2.3 – CAGR Calculator Explained: How to Calculate and Interpret Your Investment Returns
Imagine two investors.
Both begin with an investment portfolio worth $100,000.
Five years later, both portfolios are worth $160,000.
At first glance, their investment performance appears identical.
Using a standard compound annual growth rate (CAGR) calculator, both portfolios appear to have generated approximately 9.86% annualised growth.
But there is an important difference.
The first investor made no additional contributions during those five years.
The second investor added $30,000 of new capital along the way.
Although both portfolios finished at the same value, they did not generate the same investment return.
For the first investor, the 9.86% CAGR accurately describes the annualised growth of their original investment.
For the second, applying the same calculation to the starting and ending portfolio values would be misleading because some of the increase came from additional contributions rather than investment performance.
The calculation may be mathematically correct, but the interpretation can still be wrong.
This distinction matters because many investors use CAGR calculators without fully understanding what the inputs represent.
A CAGR calculator converts investment growth over a defined period into an equivalent annual compound growth rate.
It provides a useful way to compare investments, understand long-term compounding and evaluate historical performance.
But it does not automatically distinguish investment gains from additional contributions.
Nor does it establish whether the calculated return is good, whether the investor accepted excessive risk or whether the portfolio is progressing towards its financial objectives.
Those questions require a more structured approach.
For a long-term investor, the objective is not simply to calculate a percentage.
It is to understand what that percentage measures, when it provides a meaningful comparison and when a different performance calculation may be more appropriate.
This guide explains how CAGR calculators work, how to use them correctly and how to interpret the results within a wider investment-management framework.
Because understanding how your capital has compounded is valuable.
Understanding whether you have measured that growth correctly — and what it means for your investment strategy — is considerably more important.

Who This Guide Is For
This guide is for investors who:
● Want to calculate the compound annual growth rate of their investment portfolio.
● Are looking for a practical explanation of how a CAGR calculator works.
● Need to understand which figures to enter into a CAGR calculation.
● Want to calculate annualised investment returns over different time periods.
● Are unsure whether their portfolio’s reported growth represents genuine investment performance.
● Make regular contributions or withdrawals and want to understand how these affect return calculations.
● Want to calculate CAGR using Excel or a spreadsheet.
● Need to distinguish CAGR from average annual return and total portfolio growth.
● Want to compare investment performance across funds, ETFs or individual shares.
● Are evaluating whether their calculated CAGR is good relative to an appropriate benchmark.
● Want to understand how inflation, fees and investment risk affect the interpretation of CAGR.
● Want to develop a repeatable process for measuring and evaluating long-term investment performance.
Different investors approach CAGR calculations with different questions.
An early-stage investor asks:
“How much has my investment grown?”
A developing investor asks:
“What is my annualised investment return?”
A more structured investor asks:
“Have I calculated my CAGR correctly, and how does it compare with an appropriate benchmark?”
A Structured Compounder asks:
“Am I using the right performance measures to understand whether my investment strategy is delivering the compound growth required by my financial objectives?”
What You'll Learn | |
Understanding CAGR Calculators | What a CAGR calculator measures, how it works and why annualised compound growth differs from total investment return. |
The CAGR Formula | How to calculate CAGR using beginning value, ending value and the number of years invested. |
Practical CAGR Calculations | How to calculate annualised returns using realistic investment examples and different investment periods. |
Using CAGR Calculators and Excel | How to calculate CAGR manually, with an online calculator and using spreadsheet formulas. |
Contributions and Withdrawals | Why additional investments and withdrawals can make a simple CAGR calculation misleading. |
CAGR vs Other Return Measures | When to use CAGR, average annual return, total return, XIRR and time-weighted performance measures. |
Interpreting CAGR Results | How to evaluate annualised growth against benchmarks, inflation, investment costs and portfolio risk. |
Real Investor Case Study | How an investor discovered that apparently strong portfolio growth was partly explained by additional contributions. |
Structured Performance Assessment | How to use CAGR calculations within a repeatable investment monitoring and decision-making process. |
Contents
What Is a CAGR Calculator?
How Does a CAGR Calculator Work?
What Is the CAGR Formula?
How to Calculate CAGR: Step-by-Step Example
How to Use an Online CAGR Calculator
How to Calculate CAGR in Excel
How Do Contributions and Withdrawals Affect CAGR Calculations?
CAGR vs Total Return: What’s the Difference?
CAGR vs Average Annual Return: Why the Difference Matters
CAGR vs XIRR: Which Calculation Should You Use?
How to Interpret Your CAGR Calculator Results
How to Use CAGR Calculations to Monitor Investment Performance
Discover What Your Investment Returns Reveal About You
Real Investor Case Study (Toronto, Canada 🇨🇦)
The Investor Progression Model: From Calculating Returns to Understanding Investment Performance
Common CAGR Calculation Mistakes
CAGR Calculation Methods Comparison
Quick CAGR Calculation Audit
Who This Guide Is For
Who This Guide Is NOT For
Discover What Your Investment Returns Reveal About You
FAQs
Explore The Full Framework
Related Articles
Final Thought
What Is a CAGR Calculator?
A CAGR calculator is a tool that measures the compound annual growth rate of an investment over a specified period.
It converts the total change in investment value into an equivalent annual growth rate, assuming the investment had grown at a constant compounded rate.
For example, imagine an investment portfolio increasing from $100,000 to $160,000 over five years.
The total increase is $60,000, representing 60% growth.
However, that does not mean the portfolio generated a 12% annual return simply because 60% divided by five equals 12%.
Investment growth compounds.
Returns generated in earlier years become part of the capital on which subsequent returns are earned.
A CAGR calculator accounts for this compounding effect. In this example, the portfolio’s CAGR is approximately 9.86%.
That means $100,000 growing at a constant annual rate of approximately 9.86% would reach $160,000 after five years.
The actual investment returns may have varied substantially from year to year.
CAGR does not suggest that the portfolio genuinely increased by 9.86% every year.
Instead, it expresses the overall investment outcome as a single annualised compound growth rate.
This makes CAGR particularly useful when comparing investments held over different periods.
However, a standard CAGR calculator assumes that the beginning and ending values represent the growth of the same invested capital, without additional contributions or withdrawals.
If an investor adds money during the measurement period, the increase in portfolio value may partly reflect those contributions rather than investment performance.
A simple CAGR calculation cannot distinguish between the two.
For a Structured Compounder, a CAGR calculator provides a useful starting point for understanding long-term growth.
But the quality of the calculation depends on whether the figures entered accurately represent the investment return being measured.

How Does a CAGR Calculator Work?
A CAGR calculator works by identifying the constant annual compound growth rate that connects an investment’s beginning value with its ending value over a defined period.
It requires three principal inputs:
Beginning Value: The investment’s value at the start of the measurement period.
Ending Value: The investment’s value at the end of the measurement period.
Number of Years: The length of time between those two valuations.
The calculator first determines how much the investment has grown relative to its original value.
It then converts that overall growth into an annualised rate using compounding.
Consider a portfolio worth $50,000 at the beginning of a six-year period.
At the end of those six years, it is worth $85,000.
The investment has increased by 70%.
However, the CAGR is approximately 9.24%, not the 11.67% obtained by dividing 70% by six.
The difference arises because compound growth builds upon previous growth.
A 9.24% annual return increases the investment’s value in the first year. In the second year, the same percentage applies to a larger amount of capital. This process continues throughout the measurement period.
Importantly, the calculator does not need to know the return achieved in each individual year. It uses only the beginning value, ending value and investment duration.
That makes CAGR convenient, but it also creates limitations.
Two portfolios may achieve identical CAGR figures while experiencing very different levels of volatility, drawdowns and investment risk.
Similarly, the calculation can become misleading when additional capital enters or leaves the portfolio during the period.
A CAGR calculator measures the annualised growth implied by the values entered.
It does not independently verify whether those values provide a meaningful measure of investment performance.
Understanding that distinction is essential before relying on the result.
What Is the CAGR Formula?
The compound annual growth rate formula calculates the constant annual growth rate required to move an investment from its beginning value to its ending value over a specified number of years.
The formula is:
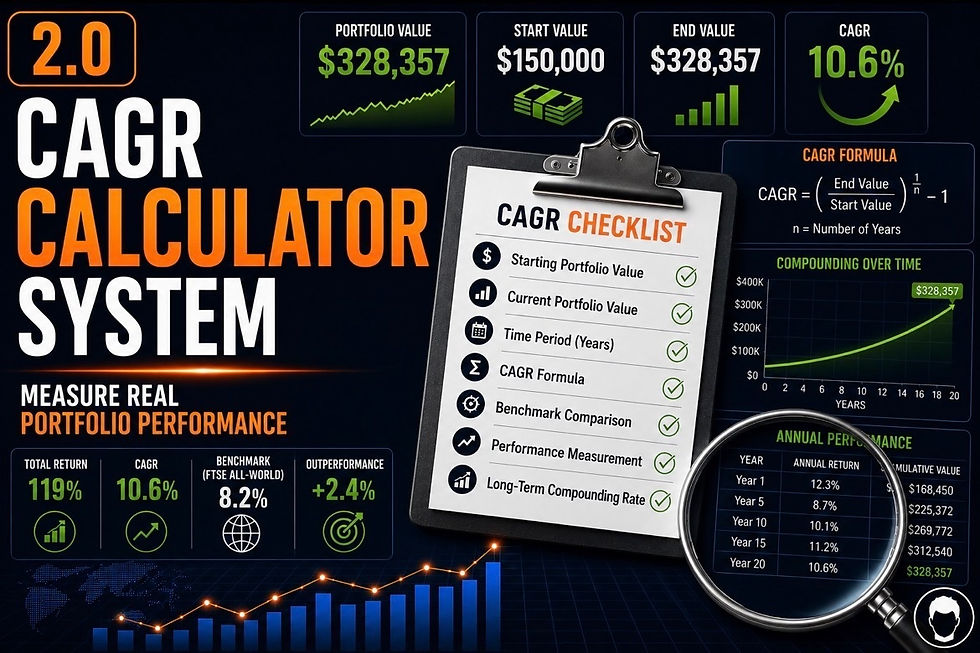
CAGR = (Ending Value / Beginning Value) ^ (1 / Number of Years) - 1
Each element has a specific purpose.
Ending Value represents the investment’s value at the end of the measurement period.
Beginning Value represents its value at the start.
Number of Years establishes how long the investment has been compounding.
The division between ending and beginning values calculates the overall growth multiple.
Raising that multiple to the power of one divided by the number of years converts it into an equivalent annual compound growth factor. Subtracting one expresses the result as an annual return.
For example, consider an investment increasing from $40,000 to $70,000 over seven years. The calculation becomes:
CAGR = (70,000 / 40,000) ^ (1 / 7) - 1
CAGR = 1.75 ^ (1 / 7) - 1
CAGR ≈ 8.31%
This means the investment achieved the same ending value as capital growing at approximately 8.31% annually for seven years.
The formula works for positive or negative investment growth, provided the beginning and ending values are positive.
It can also be applied to fractional years where the measurement period is calculated accurately.
However, the formula does not incorporate the timing of additional contributions or withdrawals. It also does not reveal the sequence of returns experienced during the investment period.
Consequently, CAGR is most straightforward when measuring the growth of a single investment without external cash flows.
The formula provides an accurate mathematical relationship between two investment values, but its usefulness depends on selecting an appropriate measurement period and valid inputs.
How to Calculate CAGR: Step-by-Step Example
Calculating CAGR manually requires only three figures: the investment’s beginning value, ending value and the number of years between them.
Consider an investor who purchases an investment worth $100,000. Five years later, the investment is valued at $160,000. The investor makes no additional contributions or withdrawals during the period.
Step 1: Identify the beginning value
Beginning Value = $100,000
This represents the capital invested at the start of the measurement period.
Step 2: Identify the ending value
Ending Value = $160,000
This represents the investment’s value after five years, including any reinvested income reflected in that valuation.
Step 3: Establish the investment period
Number of Years = 5
The period must accurately reflect the time between the two valuations.
Step 4: Apply the CAGR formula
CAGR = (160,000 / 100,000) ^ (1 / 5) - 1
CAGR = 1.6 ^ 0.2 - 1
CAGR ≈ 9.86%
Step 5: Interpret the result
The portfolio achieved a total gain of $60,000, equivalent to 60% cumulative growth. Its annualised compound growth rate was approximately 9.86%.
These figures describe different aspects of the same investment outcome.
The 60% figure measures total growth. The 9.86% CAGR expresses that growth as an equivalent annual compounded return.
The investment did not necessarily generate 9.86% in each individual year. Its actual annual returns could have included both gains and losses.
The calculation remains valid because the investor made no external contributions or withdrawals.
However, the result alone does not establish whether the investment performed well relative to its benchmark or the risks accepted.
A correct CAGR calculation establishes how capital compounded. Evaluating whether that growth represents satisfactory performance requires further analysis.
How to Use an Online CAGR Calculator
An online CAGR calculator provides a convenient way to calculate annualised compound investment growth without applying the formula manually.
Most calculators require the same three inputs: beginning value, ending value and investment duration. The process is straightforward.
First, enter the beginning investment value.
This should represent the value of the investment at the start of the measurement period.
Second, enter the ending investment value.
Use the investment’s value at the end of the period, ensuring that the valuation basis is consistent.
Third, enter the investment duration.
Some calculators accept whole years only, while others allow fractional years or specific dates.
Finally, calculate the CAGR.
For example, entering a beginning value of $75,000, an ending value of $120,000 and a six-year investment period produces a CAGR of approximately 8.15%.
The calculator expresses the investment’s 60% cumulative growth as an equivalent annual compound rate.
However, investors should check what the calculator actually measures before relying on the result.
A standard calculator generally assumes there were no external contributions or withdrawals during the measurement period.
It may also exclude dividend income unless that income is reflected in the ending investment value.
Similarly, investment fees and taxation may not be captured unless already incorporated into the figures entered.
Another important consideration is measurement consistency.
Beginning and ending values should use the same currency, and comparisons between investments should account for differences in reporting periods.
An online calculator is therefore useful for obtaining a quick and reproducible result.
But entering accurate figures is only part of the process.
A Structured Compounder also considers whether CAGR is the appropriate performance measure and whether the result can be meaningfully compared with relevant benchmarks and financial objectives.
How to Calculate CAGR in Excel
Excel provides a straightforward way to calculate CAGR and incorporate the result into a wider investment performance tracking system.
Unlike a standalone online calculator, a spreadsheet allows investors to retain historical valuations, update calculations and compare investment performance across different periods.
The simplest approach uses the standard CAGR formula.
Imagine an investment increasing from $100,000 to $160,000 over five years.

Enter the following values into Excel:
Cell B2: Beginning Value — 100000
Cell B3: Ending Value — 160000
Cell B4: Number of Years — 5
In cell B5, enter:
=(B3/B2)^(1/B4)-1
Format the result as a percentage.
Excel will display approximately 9.86%.
The same calculation can be adapted to other investments by changing the input values.
Investors can also calculate the measurement period directly from dates.
For example, if the beginning date is in B2, the ending date in B3, the beginning investment value in B4 and the ending value in B5, use:
=(B5/B4)^(365.25/(B3-B2))-1
This calculates an annualised growth rate using the elapsed calendar days.
The approach is particularly useful when investments have been held for periods that are not exact whole years.
However, the same limitation applies as with an online CAGR calculator.
If an investor has made additional contributions or withdrawals, beginning and ending values alone may not provide a meaningful measure of investment performance.
In those circumstances, Excel’s XIRR function can calculate a money-weighted return using dated cash flows, while time-weighted methods may be more appropriate for evaluating the underlying investment strategy.
For a Structured Compounder, Excel is valuable because calculations can form part of a repeatable monitoring process.
The objective is not simply to produce a CAGR figure, but to maintain reliable performance records that support informed investment decisions.
How Do Contributions and Withdrawals Affect CAGR Calculations?
A standard CAGR calculator assumes that the difference between an investment’s beginning and ending values reflects investment growth. Contributions and withdrawals can make that assumption incorrect.
Consider two investors who each start with $100,000 and finish five years later with $160,000.
Investor A makes no additional contributions. Their CAGR is approximately 9.86%.
Investor B contributes another $30,000 during the period. Applying the same beginning-and-ending-value formula also produces 9.86%, but that figure wrongly treats the additional $30,000 as investment growth.
The resulting percentage is not a reliable measure of Investor B’s investment performance.
Why Cash Flows Matter
External cash flows change the amount of capital invested. They must therefore be distinguished from gains and losses generated by the investments themselves.
A contribution increases portfolio value without necessarily producing any investment return. A withdrawal reduces portfolio value without necessarily representing an investment loss.
For example, a portfolio might increase from $100,000 to $150,000 after receiving $40,000 of contributions. Its apparent 50% growth is not equivalent to a 50% investment return.
The timing of those contributions also matters. Capital invested near the beginning of a period has more time to experience market returns than capital added near the end.
Where cash flows occur, investors should consider two alternatives.
A money-weighted return, such as XIRR, incorporates the amount and timing of contributions and withdrawals.
A time-weighted return measures investment performance by separating periods between external cash flows, reducing the influence of contribution timing.
Neither measure is universally superior. They answer different questions.
A Structured Compounder records external cash flows accurately and selects the return measure appropriate to the decision being made.
The objective is to distinguish the growth generated by investments from changes in portfolio value caused by adding or removing capital.
CAGR vs Total Return: What’s the Difference?
CAGR and total return describe different aspects of investment growth.
Total return measures the cumulative percentage change in an investment over a specified period, including reinvested income where applicable.
CAGR converts that cumulative growth into an equivalent annual compound growth rate.
Both measures can be useful, but they answer different questions.
Consider an investment that increases from $100,000 to $180,000 over eight years, without additional contributions or withdrawals.
The total return is:
Total Return = ((Ending Value / Beginning Value) - 1) × 100
Total Return = (($180,000 / $100,000) - 1) × 100
Total Return = 80%
The CAGR is:
CAGR = ($180,000 / $100,000) ^ (1 / 8) - 1
CAGR ≈ 7.63%
The investment has grown by 80% overall, equivalent to approximately 7.63% annualised compound growth.
These figures are not contradictory. They describe the same outcome from different perspectives.
Why Investment Duration Matters
Imagine two investments that both generate an 80% total return.
The first achieves that result over five years.
The second requires fifteen years.
Their cumulative gains are identical, but their annualised compound returns are substantially different.
Table – How Investment Duration Changes CAGR
Investment Period | CAGR on an 80% Total Return |
5 years | 12.48% |
8 years | 7.63% |
10 years | 6.05% |
15 years | 4.00% |
The shorter investment period produces a higher CAGR because the same cumulative growth occurred more quickly.
This makes CAGR particularly useful when comparing investments held for different durations.
However, neither total return nor CAGR automatically establishes whether an investment performed satisfactorily.
Both require appropriate context, including benchmarks, risk, costs and investment objectives.
A Structured Compounder uses total return to understand cumulative growth and CAGR to assess the annualised rate of compounding.
The distinction is not which measure is better, but which measure answers the investment question being asked.
CAGR vs Average Annual Return: Why the Difference Matters
CAGR and average annual return are frequently confused because both express investment performance as annual percentages.
However, they measure different things. Average annual return usually refers to the arithmetic mean of individual yearly returns. CAGR measures the annualised compound growth achieved over the entire investment period.
The distinction becomes important when returns fluctuate.
Consider an investor starting with $100,000.
In the first year, the investment gains 40%.
In the second year, it loses 30%.
The arithmetic average annual return is:
Average Annual Return = (40% - 30%) / 2
Average Annual Return = 5%
That appears to suggest positive annual growth of 5%. But the actual portfolio values tell a different story.
After the first year:
$100,000 × 1.40 = $140,000
After the second year:
$140,000 × 0.70 = $98,000
The investment finishes below its original value.
Its CAGR is:
CAGR = ($98,000 / $100,000) ^ (1 / 2) - 1
CAGR ≈ -1.01%
The arithmetic average is positive, but the investment has lost capital.
Why Volatility Changes Compound Outcomes
Investment losses have an asymmetric effect on recovery.
A 20% decline requires a subsequent 25% gain to restore the original value.
A 40% decline requires approximately 66.67%.
This means two investments with similar arithmetic average returns can experience different compound growth outcomes.
CAGR captures the overall compounding effect, although it does not reveal the sequence or severity of individual annual returns.
A Structured Compounder therefore distinguishes arithmetic averages from realised compound growth.
Both calculations can provide useful information, but they should not be treated as interchangeable.
For evaluating long-term investment growth, the compound outcome matters more than the arithmetic average of annual percentages.
CAGR vs XIRR: Which Calculation Should You Use?
CAGR and XIRR both express investment returns as annualised percentages, but they are designed for different circumstances.
CAGR measures the annualised growth between an investment’s beginning and ending values.
XIRR calculates a money-weighted annualised return using the amounts and dates of individual cash flows.
The distinction matters when investors make additional contributions or withdrawals.
Consider a portfolio that begins with $100,000 and finishes three years later with $170,000.
If no additional money entered or left the portfolio, its CAGR would be approximately 19.35%.
But suppose the investor contributed another $40,000 at the end of the first year. The simple CAGR formula would incorrectly treat the entire increase as investment growth.
XIRR can incorporate that contribution and its timing.
Choosing the Appropriate Return Measure
Table – CAGR vs XIRR
CAGR | XIRR |
Uses beginning value, ending value and investment duration | Uses dated contributions, withdrawals and ending value |
Suitable for investments without external cash flows | Suitable for portfolios with external cash flows |
Measures annualised growth between two valuations | Measures the annualised money-weighted return on invested capital |
Does not account for contribution timing | Accounts for the timing and size of cash flows |
Useful for comparing simple investment growth outcomes | Useful for assessing the investor's experienced return |
XIRR is particularly useful when reviewing the return earned on capital invested at different dates.
However, money-weighted returns are influenced by when investors contribute or withdraw funds.
That can make XIRR less suitable for evaluating investment-management decisions independently of external cash flows.
For that purpose, a time-weighted return may provide a more appropriate comparison with a market benchmark.
A Structured Compounder understands that these calculations serve different purposes.
CAGR measures compound growth without external cash flows. XIRR measures the investor’s money-weighted return. Time-weighted returns help isolate investment performance from contribution timing.
The correct choice depends on what the investor is trying to understand.
How to Interpret Your CAGR Calculator Results
A CAGR calculator provides an annualised growth percentage, but interpreting that percentage requires more than deciding whether it appears high or low.
An investment achieving 10% CAGR may represent excellent performance in one context and disappointing performance in another.
The relevant assessment depends on the investment strategy, benchmark, inflation, costs and risks accepted.
Consider an investor whose portfolio achieves an 8% CAGR over ten years. That result indicates meaningful compound growth.
However, suppose the portfolio follows a global equity strategy and its appropriate benchmark achieves 11% over the same period. The investor has generated positive returns but underperformed the benchmark.
Conversely, an 8% CAGR might represent strong performance for a diversified portfolio whose relevant benchmark achieved 6%.
The reported CAGR is identical.
Its interpretation is different.
A Practical CAGR Interpretation Framework
Table – What to Examine After Calculating CAGR
Assessment Factor | Question to Consider |
Benchmark | Did the investment outperform an appropriate comparison? |
Inflation | How much purchasing power did the investment gain? |
Investment Costs | Are the reported returns gross or net of charges? |
Risk | What volatility, drawdowns and concentration accompanied the return? |
Investment Period | Is the measurement period long enough to be meaningful? |
Financial Objectives | Does the achieved growth support the investor's intended outcomes? |
Investors should also distinguish historical CAGR from expected future returns.
A strong five-year result does not guarantee that the same growth rate will continue. Market valuations, interest rates and economic conditions can change substantially.
A CAGR calculator measures what happened during the selected period. It cannot determine what will happen next.
A Structured Compounder therefore treats the calculated percentage as one component of a wider performance assessment.
The important question is not simply whether CAGR is high, but whether the return represents satisfactory progress within a deliberate investment strategy.
How to Use CAGR Calculations to Monitor Investment Performance
CAGR becomes more valuable when it forms part of a consistent investment monitoring process rather than an occasional calculation.
Investors often review portfolio values frequently but calculate annualised performance less systematically.
That can make it difficult to distinguish long-term investment progress from recent market movements.
A structured approach begins with reliable portfolio records.
Investors should maintain consistent valuation dates, record external contributions and withdrawals, and understand whether their reported returns include dividends and investment costs.
Where appropriate, they should calculate CAGR across multiple periods.
One-year performance provides information about recent returns.
Three-, five- and ten-year annualised figures can offer additional perspective where sufficient investment history exists.
However, shorter measurement periods may be heavily influenced by prevailing market conditions.
Building a Repeatable Performance Monitoring Process
Table – CAGR Monitoring Framework
Monitoring Stage | Practical Application |
Maintain Portfolio Records | Record consistent valuations and external cash flows |
Calculate Annualised Returns | Use CAGR or a cash-flow-aware measure as appropriate |
Compare Performance | Assess returns against relevant benchmarks over matching periods |
Evaluate Real Growth | Consider inflation-adjusted investment performance |
Review Risk and Costs | Examine drawdowns, concentration and net returns |
Assess Financial Progress | Determine whether investment growth supports long-term objectives |
This process should also connect performance measurement with the investor’s strategic asset allocation.
A portfolio designed around diversified equities and bonds should not automatically be judged against a concentrated equity index.
Similarly, temporary underperformance does not necessarily justify changing investments.
The objective is to understand whether the portfolio continues to perform consistently with its intended strategy.
For a Structured Compounder, monitoring CAGR is therefore part of a wider system linking portfolio tracking, allocation, risk management and financial planning.
The value of a CAGR calculator is not simply the percentage it produces, but the disciplined decisions that reliable performance measurement can support.
Discover What Your Investment Returns Reveal About You
Calculating your compound annual growth rate (CAGR) is an important step towards understanding investment performance.
But a mathematically correct CAGR doesn’t automatically mean your portfolio is being measured or managed effectively.
The important question is whether your calculations accurately reflect investment growth, account for contributions and withdrawals, and provide meaningful information about the performance of your investment strategy.
The Free Investor Assessment helps identify:
Portfolio performance measurement and investment strategy blind spots.
Whether your investment decisions reflect a deliberate process or reactions to recent returns.
Potential weaknesses in your approach to portfolio tracking, asset allocation and risk management.
Your current Investor Progression Model stage.
Practical next steps towards becoming a Structured Compounder.
Because successful long-term investing isn’t simply about calculating an attractive annualised return.
It’s about understanding what your investments have actually earned, how that performance compares with appropriate benchmarks and whether your portfolio is progressing towards its financial objectives.
And once those relationships are understood, you can make better-informed decisions about portfolio construction, investment monitoring, risk management and long-term compounding.
Only takes 2-minutes • manually reviewed • delivered within 24 hours
The Toronto Investor Whose Portfolio Underperformed the Market — Yet Left Him $87,000 Better Off
A 47-year-old investor in Toronto had spent three years building a long-term investment portfolio.
He initially invested $100,000 and subsequently contributed another $300,000 following the sale of a business interest.
Three years after his original investment, his portfolio was worth $543,400.
Against total contributions of $400,000, he had generated $143,400 in investment gains.
He considered this a satisfactory outcome.
However, when he compared his portfolio’s annualised investment performance against a broad equity benchmark, he discovered something troubling.
His portfolio’s time-weighted CAGR was approximately 4.59%.
The benchmark had achieved 6%.
His investment strategy had underperformed.
He began questioning whether he should abandon his existing portfolio and replace it with a passive benchmark-tracking investment.
What he had not realised was that the apparent underperformance concealed a very different financial outcome.
The Investment Strategy That Appeared to Be Underperforming
The investor’s portfolio had experienced three contrasting years.
During the first year, its value declined by 20%, reducing his original $100,000 investment to $80,000.
At that point, he received $300,000 from the sale of a business interest.
Rather than holding the proceeds in cash, he invested the entire amount into his existing portfolio.
His invested capital therefore increased to $380,000.
During the second year, the portfolio recovered by 30%.
In the third year, it gained a further 10%.
By the end of the period, the portfolio was worth $543,400.
However, the portfolio’s time-weighted CAGR was calculated from its underlying annual returns:
CAGR = (0.80 × 1.30 × 1.10) ^ (1 / 3) - 1
Time-Weighted CAGR ≈ 4.59%
Against a benchmark delivering 6% annually, the portfolio had underperformed by approximately 1.41 percentage points per year.
The investor assumed this meant he would have been financially better off investing in the benchmark.
But that conclusion overlooked when his capital had actually been invested.

What The Review Revealed
The review examined the portfolio’s investment returns alongside the timing of the investor’s contributions.
Although the portfolio had declined during the first year, most of the investor’s capital entered immediately afterwards.
Consequently, the subsequent recovery applied to substantially more capital than the original decline.
The review then compared his actual outcome with a benchmark portfolio receiving exactly the same contributions on the same dates.
Table – Toronto Investor Performance Comparison
Performance Measure | Investment Outcome |
Initial Investment | $100,000 |
Additional Contribution | $300,000 at End of Year 1 |
Total Capital Invested | $400,000 |
Portfolio Value After 3 Years | $543,400 |
Portfolio Time-Weighted CAGR | 4.59% |
Benchmark Annualised Return | 6.00% |
Investor Money-Weighted Return (XIRR) | 14.50% |
Cash-Flow-Matched Benchmark Value | $456,182 |
Additional Wealth vs Benchmark | $87,218 |
The result was unexpected.
Despite underperforming the benchmark on a time-weighted basis, the investor had accumulated approximately $87,218 more wealth than the benchmark would have produced under the same contribution schedule.
His money-weighted return was approximately 14.50%. The benchmark comparison had not been wrong. It had simply answered a different question.
The Real Issue
The investor had assumed that a lower portfolio CAGR necessarily meant his investment decisions had produced an inferior financial outcome.
But time-weighted and money-weighted returns measure different aspects of investment performance.
The time-weighted calculation showed that his investment strategy had underperformed the benchmark.
The money-weighted calculation reflected the return experienced on his actual invested capital, including the timing of his $300,000 contribution.
Both results were correct.
Importantly, the favourable contribution timing did not necessarily demonstrate exceptional investment skill.
The business sale had determined when the money became available.
Had the contribution occurred before the market decline rather than afterwards, the outcome could have been very different.
The investor had benefited from favourable timing without necessarily possessing a repeatable ability to predict market movements.
His mistake was not calculating CAGR incorrectly. It was assuming that one performance measure could answer every investment question.
What Changed
The investor introduced three separate measures into his portfolio monitoring process.
First, he used time-weighted returns to evaluate his investment strategy against an appropriate benchmark.
Second, he calculated XIRR to understand the annualised return earned on his actual invested capital.
Third, he compared his portfolio’s value with a cash-flow-matched benchmark to establish the financial consequence of his investment decisions.
This gave him a clearer distinction between strategy performance, personal investment returns and accumulated wealth.
He also recognised that a favourable historical outcome did not automatically justify retaining an underperforming strategy.
The review therefore informed a more disciplined assessment rather than an immediate decision to abandon or defend the portfolio.
For a Structured Compounder, the lesson is fundamental.
A portfolio can underperform its benchmark while an investor accumulates more wealth than the benchmark alternative. Understanding that apparent contradiction requires measuring the right thing, not simply calculating another percentage.
The Investor Progression Model: From Calculating Returns to Understanding Investment Performance
Calculating CAGR is straightforward. Understanding what it reveals about investment performance requires a more structured approach.
Many investors track portfolio growth and calculate annualised returns without distinguishing investment gains from contributions, assessing benchmark performance or considering investment risk.
A portfolio can report an impressive CAGR while underperforming its benchmark.
Equally, an investor may accumulate more wealth than a benchmark alternative despite achieving a lower time-weighted return.
The Investor Progression Model explains how investors develop from observing portfolio growth towards systematically evaluating investment performance.
An early-stage investor asks:
“How much has my portfolio grown?”
A developing investor asks:
“What is my annualised investment return?”
A more structured investor asks:
“Am I calculating my returns correctly, and how do they compare with an appropriate benchmark?”
A Structured Compounder asks:
“Does my performance measurement system distinguish investment returns from cash flows, evaluate risk and benchmarks, and demonstrate progress towards my financial objectives?”
These questions reflect a progression from calculating returns towards understanding what those returns mean.
The Five Stages of Investment Performance Understanding
Track Portfolio Value → Calculate CAGR → Account for Cash Flows → Evaluate Performance → Monitor Financial Progress
Each stage develops the investor’s understanding.
Tracking portfolio value establishes financial growth. CAGR measures annualised compounding. Accounting for cash flows separates contributions from investment returns.
Benchmark comparisons and risk assessment establish whether performance is satisfactory, while monitoring financial progress connects investment outcomes to long-term objectives.
Consider the following questions:
● Do you distinguish portfolio growth from investment returns?
● Do you know when a standard CAGR calculation is appropriate?
● Do you record contributions and withdrawals accurately?
● Can you explain the difference between CAGR and XIRR?
● Do you compare returns against appropriate benchmarks?
● Do your performance figures account for costs and reinvested income?
● Do you assess investment risk alongside annualised returns?
● Can you demonstrate whether your portfolio supports your financial objectives?
These questions help identify whether performance measurement forms part of a repeatable investment process.
The Investor Progression Model identifies four approaches to investment decision-making.
A Reactive Investor focuses primarily on portfolio balances, often interpreting rising values as investment success without distinguishing contributions from investment gains. Decisions may be influenced by recent market movements.
A Lucky Investor may achieve impressive returns through favourable market conditions, investment selection or contribution timing, without understanding how much of the outcome reflects repeatable investment skill.
A Conservative Compounder typically follows a disciplined, diversified investment strategy but may rely on basic performance measures that provide limited insight into benchmark performance or financial progress.
A Structured Compounder uses a repeatable system combining appropriate return calculations, cash-flow records, benchmark comparisons, risk assessment and financial objectives to evaluate investment performance.
The distinction is not that Structured Compounders always achieve higher returns.
It is that they understand what their performance measures reveal and use that information to make more informed decisions.
As the Toronto case study demonstrated, apparently contradictory performance figures can both be correct because they measure different outcomes.
A Structured Compounder recognises that CAGR, XIRR and benchmark comparisons answer different questions.
The progression from calculating CAGR to understanding investment performance is ultimately a progression from observing financial outcomes to making informed, repeatable investment decisions.

Common CAGR Calculation Mistakes
A CAGR calculator can produce a mathematically correct result while still giving an investor a misleading impression of performance.The most common mistakes arise from inappropriate inputs, inconsistent measurement periods or incorrect interpretation.
● Confusing Portfolio Growth with Investment Returns: An increase in portfolio value may include additional contributions. Treating the entire increase as investment performance can substantially overstate the return achieved.
● Ignoring Contributions and Withdrawals: Standard CAGR calculations do not account for external cash flows. Investors making regular contributions may need XIRR or time-weighted returns instead.
● Using Incorrect Investment Periods: CAGR depends on the measurement period. Using five years when an investment was held for four years and six months changes the calculated annualised return.
● Confusing CAGR with Average Annual Return: Arithmetic averages do not account for the compounding effects of fluctuating returns. A positive average annual return can coexist with an investment loss.
● Excluding Reinvested Dividends: Calculating returns from share-price movements alone can understate total investment performance when dividends have been received or reinvested.
● Comparing Different Measurement Periods: A five-year portfolio CAGR should not be directly compared with a benchmark’s ten-year return without adjusting the comparison.
● Ignoring Investment Costs and Inflation: A strong nominal CAGR may produce considerably less real growth after fees, taxation and changes in purchasing power.
● Treating Historical CAGR as a Forecast: CAGR describes past compound growth. It does not establish the return an investment will generate in future.
These mistakes share a common weakness: relying on the calculated percentage without examining what it represents.
Accurate Inputs → Appropriate Calculation → Meaningful Comparison → Informed Investment Decisions
A Structured Compounder understands that reliable performance measurement begins before the CAGR formula is applied.
The objective is not simply to calculate returns correctly, but to ensure those calculations support sound investment decisions.
CAGR Calculation Methods Comparison
Different investment return calculations answer different questions.
Understanding their respective purposes helps investors avoid interpreting portfolio growth, annualised returns and investment strategy performance as interchangeable measures.
Basic Return Calculation | Structured Performance Measurement |
Focuses on the change in portfolio value | Distinguishes portfolio growth from investment returns |
Uses beginning and ending values without checking cash flows | Identifies contributions and withdrawals before selecting a calculation |
Treats total return and CAGR as interchangeable | Distinguishes cumulative growth from annualised compounding |
Uses arithmetic averages to describe long-term growth | Uses compound returns to evaluate investment growth |
Applies CAGR regardless of contribution activity | Uses CAGR, XIRR or time-weighted returns as appropriate |
Assumes the calculated percentage represents investment skill | Separates investment outcomes from market conditions and cash-flow timing |
Compares returns across inconsistent periods | Uses matching measurement periods and valuation dates |
Focuses on nominal investment growth | Considers inflation, fees and net investment returns |
Judges performance primarily by the reported percentage | Assesses benchmarks, risk and investment objectives |
Calculates performance occasionally | Maintains a repeatable portfolio performance monitoring process |
Quick CAGR Calculation Audit
Calculating CAGR is straightforward. Determining whether the result provides a meaningful assessment of investment performance requires additional checks. Ask yourself:
✓ Do I know my portfolio’s annualised compound growth rate?
✓ Have I used accurate beginning and ending investment values?
✓ Is my investment measurement period correct?
✓ Have I distinguished investment gains from additional contributions?
✓ Do I understand when a standard CAGR calculation becomes misleading?
✓ Can I explain the difference between total return and CAGR?
✓ Do I understand when XIRR is more appropriate?
✓ Have I accounted for reinvested dividends?
✓ Do my calculations reflect relevant investment costs?
✓ Am I comparing returns against an appropriate benchmark?
✓ Do I consider investment risk alongside annualised returns?
✓ Can I explain whether my portfolio’s performance supports my financial objectives?
If you cannot confidently answer several of these questions, your performance measurement process may be incomplete.
You may already be calculating investment returns accurately while lacking the information needed to interpret them effectively.
The objective is not to make portfolio monitoring unnecessarily complicated.
It is to establish a consistent process that produces meaningful information.
Record Portfolio Values → Select the Correct Calculation → Evaluate Performance → Monitor Financial Progress
A Structured Compounder uses performance calculations to understand investment outcomes, identify potential weaknesses and support disciplined long-term decisions.
Who This Guide Is For
This guide is for investors who:
✓ Want to calculate the compound annual growth rate of their investments.
✓ Need to understand how CAGR calculators work.
✓ Want to calculate investment returns using Excel.
✓ Make regular contributions or withdrawals.
✓ Are unsure whether portfolio growth represents genuine investment performance.
✓ Want to distinguish CAGR from total return and average annual return.
✓ Need to understand when XIRR is more appropriate.
✓ Want to compare investment returns against relevant benchmarks.
✓ Are developing a more structured portfolio monitoring process.
✓ Want to connect investment performance with long-term financial objectives.
You do not need advanced mathematical knowledge to calculate CAGR or understand its limitations.
However, investors who want to evaluate their performance consistently benefit from understanding which calculations are appropriate and how the results should be interpreted.
This guide provides the foundations for developing that understanding within a more systematic investment-management process.
Who This Guide Is NOT For
This guide is not designed for investors who:
● Want a calculator to predict future investment returns.
● Expect historical CAGR to guarantee future performance.
● Are looking for short-term trading signals.
● Want recommendations for specific shares or funds.
● Believe the highest CAGR always represents the best investment strategy.
● Prefer to judge performance without considering investment risk.
● Are unwilling to distinguish investment outcomes from additional contributions.
A CAGR calculator measures historical compound growth. It cannot predict markets or determine whether an investment is suitable for an individual’s circumstances.
This guide focuses on understanding investment performance and developing a repeatable process for evaluating long-term financial progress.
Discover What Your Investment Returns Reveal About You
Most investors can already see how their portfolio has changed over time. They can identify:
● Their current portfolio value.
● The amount of capital they have contributed.
● Their total investment gains.
● Their reported annualised returns.
● The performance of individual investments.
Yet many still struggle to answer more important questions about their overall investment process.
● Am I calculating my investment returns correctly?
● How much of my portfolio growth comes from investment performance rather than contributions?
● Am I using the right return calculation for my circumstances?
● Is my portfolio outperforming an appropriate benchmark?
● What investment risks have I accepted to achieve those returns?
● Does my portfolio monitoring provide enough information to support decisions?
● Am I progressing towards becoming a more structured long-term investor?
A CAGR calculator can help measure investment growth. But calculating a percentage is not the same as understanding whether your investment strategy is working.
The Free Investor Assessment helps identify:
● Potential weaknesses in your portfolio monitoring and investment decision-making.
● Whether your approach reflects a deliberate investment strategy.
● Gaps in your understanding of performance, allocation and risk.
● Your current position within the Investor Progression Model.
● Practical opportunities to develop a more structured investment process.
Your portfolio may already be generating satisfactory returns.
The important question is whether you understand why those returns have occurred and whether your investment process is sufficiently robust to support your long-term objectives.
Takes Less Than 2-Minutes
FAQs
What is a CAGR calculator?
A CAGR calculator measures the compound annual growth rate of an investment over a specified period. It converts the overall change in investment value into an equivalent annual compound growth rate using the beginning value, ending value and investment duration.
How do I calculate CAGR?
Divide the ending investment value by the beginning value, raise the result to the power of one divided by the number of years, then subtract one. Multiply the result by 100 to express CAGR as a percentage.
What is the CAGR formula?
The formula is:
CAGR = (Ending Value / Beginning Value) ^ (1 / Number of Years) - 1
It calculates the constant annual compound growth rate equivalent to an investment’s cumulative growth over the selected period.
Can I calculate CAGR in Excel?
Yes. If the beginning value is in B2, ending value in B3 and number of years in B4, enter =(B3/B2)^(1/B4)-1. Format the result as a percentage. This calculation assumes no external contributions or withdrawals.
Does CAGR include dividends?
CAGR includes dividends when they are reflected in the investment values used for the calculation. If dividends have been paid out and excluded from the ending value, a simple price-based CAGR will not capture the full investment return.
Can CAGR be negative?
Yes. CAGR is negative when an investment’s ending value is below its beginning value, assuming both values are positive. For example, an investment declining from $100,000 to $80,000 over five years has a CAGR of approximately -4.36%.
Is CAGR the same as average annual return?
No. Average annual return usually refers to the arithmetic mean of yearly returns. CAGR measures the annualised compound growth achieved over the full period and accounts for the effect of gains and losses compounding.
Does CAGR account for additional contributions?
No. A standard CAGR calculation does not distinguish investment growth from additional contributions or withdrawals. Investors with external cash flows may need XIRR or time-weighted returns to measure performance appropriately.
What is the difference between CAGR and XIRR?
CAGR measures annualised growth between two investment values without external cash flows. XIRR calculates a money-weighted annualised return using dated contributions, withdrawals and the final investment value. They answer different performance questions.
What is a good CAGR for an investment portfolio?
A good CAGR depends on the investment strategy, benchmark, risk, costs and financial objectives. A higher percentage does not automatically indicate better performance. Investors should compare their returns with appropriate benchmarks over consistent measurement periods.
Explore The Full Framework
The Investor Progression Model White Paper |
This guide forms part of the Compounding Investor Progression Model—a framework designed to help investors move from reactive decision-making towards a repeatable, structured investment process. Inside the white paper you’ll discover: ✓ The four investor types ✓ Why most investors plateau ✓ The five dimensions of investor progression ✓ How Structured Compounders build repeatable systems ✓ The research behind the Investor Assessment |
⬇ READ THE WHITE PAPER ⬇ |
Related Articles
Continue Building Your Portfolio Management System
Understand how consolidated portfolio tracking helps investors monitor holdings, allocation and long-term investment performance.
Explore how structured portfolio records support more reliable investment tracking and performance measurement.
Understand how portfolio allocation analysis helps investors connect investment returns with their overall strategy.
Learn how compound annual growth rate is calculated and why it provides a useful measure of long-term investment growth.
Learn how to evaluate CAGR against benchmarks, inflation, investment costs, risk and long-term financial objectives.
Learn how to distinguish restoring strategic allocation targets from deliberately changing portfolio exposure in response to market conditions.
Explore calendar-based and threshold-based rebalancing approaches for controlling portfolio drift and maintaining intended risk exposure.
Final Thought
A CAGR calculator answers a straightforward question:
At what annual compound rate has an investment grown?
But understanding investment performance requires more than calculating that percentage.
An investor may achieve an impressive CAGR without outperforming an appropriate benchmark.
A portfolio may increase substantially because of additional contributions rather than investment gains.
And two investors with identical time-weighted returns may experience very different money-weighted outcomes because their capital was invested at different times.
These distinctions explain why CAGR should be interpreted within a wider investment-management framework. Five considerations are particularly important:
● Compound Growth: CAGR measures the annualised rate at which investment capital has grown over a defined period.
● Cash Flows: Contributions and withdrawals can make simple beginning-and-ending-value calculations misleading.
● Benchmark Performance: Investment returns should be compared with appropriate benchmarks over consistent measurement periods.
● Investment Risk: A higher CAGR does not automatically justify greater volatility, concentration or potential drawdowns.
● Financial Objectives: Investment performance ultimately matters because of the financial outcomes it is intended to support.
A Structured Compounder understands that different performance measures answer different questions.
CAGR provides a useful measure of compound growth.
XIRR helps explain the return experienced on invested capital.
Time-weighted returns can help evaluate investment strategy performance independently of external cash-flow timing.
Used appropriately, these measures provide a more complete understanding of investment outcomes.
The objective is not to produce the highest possible CAGR or calculate increasingly complicated performance statistics.
It is to establish a reliable system for understanding how investments are performing, why particular outcomes have occurred and whether the portfolio remains aligned with its intended purpose.
A CAGR calculator tells you how your investment has compounded. A structured investment process helps you understand what that growth actually means.


Comments