3.0 - How to Build An Asset Allocation Spreadsheet in Excel
- Compounding Investor
- Apr 10
- 13 min read
Updated: Jul 12
Most investors think they’re diversified because they own “a few different things.” But diversification isn’t the same as allocation control. Allocation is the part that stops one position, one sector, or one theme quietly taking over your portfolio.
Most investors think allocation is a spreadsheet problem.
Structured Compounders understand it is actually a behaviour problem.
Allocation reveals how investors make decisions, how risk accumulates, and whether a portfolio is being managed intentionally or accidentally.
In many cases, allocation tells you more about an investor than performance.
When you don’t track allocation, you usually end up with:
Overexposure to a single stock/sector/theme
Imbalances that creep in over time (often without you noticing)
Poor decisions driven by emotion (adding to what’s already run up, ignoring what’s fallen behind)
A simple Excel allocation spreadsheet fixes this. It gives you one place to see what you own, what it’s worth, what percentage each holding represents, and whether you’re drifting away from your targets.
Who This Guide Is For
This guide is for investors who:
• want to control portfolio risk properly
• feel their portfolio has become unbalanced over time
• use Excel or spreadsheets to track investments
• want to avoid concentration risk and emotional investing
• want a repeatable portfolio allocation framework
• want to rebalance logically instead of reacting emotionally
• want to understand what they actually own underneath ETFs and funds
What You'll Learn | |
What portfolio allocation actually means | So you understand what risk you truly own |
How to build an allocation spreadsheet in Excel | So you can track portfolio structure properly |
Allocation vs diversification | So you don’t mistake owning “lots of things” for proper balance |
How to track allocation drift | So winners don’t silently dominate your portfolio |
How to rebalance logically | So decisions become process-driven instead of emotional |
How to rebalance logically | So your portfolio doesn’t become accidentally concentrated |
Portfolio architecture | So you can structure your portfolio intentionally |
How allocation improves long-term returns | So you can structure your portfolio intentionally |
What allocation reveals about Investor Type | What allocation reveals about Investor Type |
Contents
What portfolio allocation actually means
Why allocation matters more than most investors realise
Allocation vs diversification (critical difference)
How to build an allocation spreadsheet in Excel step-by-step
How to calculate portfolio allocation percentages
How to track drift and rebalance logically
Common allocation mistakes investors make
Why portfolio structure affects long-term CAGR
Without vs with a proper allocation system
FAQ
Related Guides
Allocation overview (how I plan my strategy)

Quick Answer: How to Build an Asset Allocation Spreadsheet
Column | Purpose |
Holding | Stock, ETF or fund name |
Units | Number of shares or units |
Price | Current price |
Value | Units × Price |
Target % | Desired allocation |
Actual % | Current allocation |
Variance | Actual % minus Target % |
Action | Add, hold, trim or rebalance |
Value = Units × Price
Actual Allocation % = Holding Value / Total Portfolio Value
Variance = Actual % - Target %
Quick Allocation Audit
If you cannot answer these questions quickly, your portfolio probably has hidden blind spots:
• Do you have target allocations?
• Do you know your largest position?
• Do you know your sector exposure?
• Do you know your geographic exposure?
• Do you know where allocation drift exists?
• Do you know your Investor Type?
• Are your allocations intentional or accidental?
• Could you explain why your portfolio is structured this way?
Most investors believe they have diversification. Far fewer have portfolio structure.
The Investor Assessment reveals the difference.
Discover Your Investor Type
What is portfolio allocation?
Portfolio allocation is simply the percentage of your total portfolio that’s invested in each asset (or bucket).
Allocation is also the foundation of portfolio benchmarking and performance measurement. Without understanding how capital is distributed across holdings, sectors, and geographies, investors cannot properly evaluate whether returns are coming from skill, concentration, or simple market exposure.
Example: if your portfolio is worth $100,000 and you have $12,000 in a global equity ETF, that ETF is 12% of your portfolio.
You can track allocation at different levels depending on how you invest:
By holding (each stock/ETF/fund)
By asset class (equities, bonds, cash, alternatives)
By sector or theme (tech, healthcare, energy, etc.)
By geography
For most investors, allocation is the missing layer between “buying investments” and actually managing a portfolio properly.
Most portfolios drift slowly over time:
• winners become oversized
• sectors quietly dominate
• ETF overlap increases
• geographic exposure becomes distorted
• risk rises without the investor noticing
This is why allocation tracking matters. It turns a collection of holdings into a structured investment system.

This is the strategic architecture behind the portfolio. Instead of reacting emotionally to markets, allocation gives you predefined rules around:
• position sizing
• concentration limits
• sector exposure
• geographic balance
• portfolio risk profile
Without this structure, portfolios usually become accidental rather than intentional.
Take the free 2-minute Investor Assessment
This is why allocation is often one of the first areas reviewed during the Investor Assessment. Allocation reveals whether portfolio decisions are being driven by a system or by habit.
For many investors it is the fastest way to uncover hidden portfolio weaknesses.
Why allocation matters (in real life)
Allocation is risk control. It’s the difference between “I like this stock” and “I’m willing to let this stock become 25% of my net worth.”
A good allocation process helps you:
Stay disciplined: you add based on targets, not headlines
Avoid emotional overexposure: winners don’t silently dominate your portfolio
Rebalance with confidence: you can see exactly what’s overweight/underweight
Make better decisions: you know the impact of every buy/sell before you place it
If you’ve ever looked at your portfolio and thought “I’m not sure what I’m actually exposed to,” this spreadsheet solves that in under an hour.
Where Allocation Fits in the Investor Progression Model
Most investors think allocation is a spreadsheet exercise. It isn’t.
Allocation is one of the key behaviours that separates different types of investors.
Reactive Investors often have no target allocations at all. Positions grow randomly over time, concentration risk builds unnoticed, and decisions are driven by headlines or emotions.
Lucky Investors may achieve strong returns for a period, but often discover their portfolio success came from a handful of oversized positions or favourable market conditions rather than a repeatable process.
Conservative Compounders introduce allocation targets, diversification rules, and regular reviews. Returns become more consistent because risk is managed deliberately rather than accidentally.
Structured Compounders use allocation as part of a complete investment system. They continuously monitor position sizing, sector exposure, geographic balance, ETF overlap, and portfolio drift to maximise long-term compounding.

The goal is not simply to own investments.
The goal is to move from Reactive Investor (Level 1) towards Structured Compounder (Level 4) by replacing emotion with process and replacing accidental outcomes with repeatable results.
Allocation is often one of the first steps investors take on that journey.
Most investors expect the assessment to tell them what type of investor they are. What surprises them is how accurately allocation behaviour predicts long-term outcomes.
The strongest investors do not have better spreadsheets.
They have better allocation discipline.
Allocation Blind Spots Through The Investor Progression Model
Each investor type tends to suffer from different allocation blind spots.
Reactive Investor
No allocation targets
No position size limits
Decisions driven by emotion
Portfolio structure changes randomly
Lucky Investor
Strong returns mask concentration
Winners become oversized
Risk rises unnoticed
Market tailwinds disguise weaknesses
Conservative Compounder
Allocation framework exists
ETF overlap remains hidden
Geographic concentration develops
Allocation drift slowly accumulates
Structured Compounder
Allocation targets defined
Drift measured
Concentration monitored
Overlap reviewed
Portfolio structure managed deliberately
Every investor type has predictable blind spots.
The assessment identifies which blind spots are most likely to be affecting your portfolio today.
This is often where the biggest opportunities for improvement are found. Allocation is not simply about percentages. It is about identifying and removing blind spots before they become portfolio risks.
Allocation vs Diversification (Critical Difference)
Most investors think diversification means: “I own enough different things.”
But diversification alone is not enough.
You can own:
• 12 ETFs
• 30 stocks
• multiple funds
…and still be massively concentrated underneath.
Example:
• S&P 500 ETF
• Nasdaq ETF
• Global Tech ETF
• AI ETF
This may appear diversified, but the underlying exposure is heavily concentrated in the same technology companies.
This is why many investors unknowingly create hidden ETF overlap. Multiple funds may appear diversified on the surface while still creating concentrated exposure to the same underlying companies, sectors, or themes.
Allocation solves this problem because it measures:
• percentage exposure
• sector concentration
• geographic balance
• position sizing
• overlap risk
Diversification is what you own. Allocation is how much risk each area actually represents.
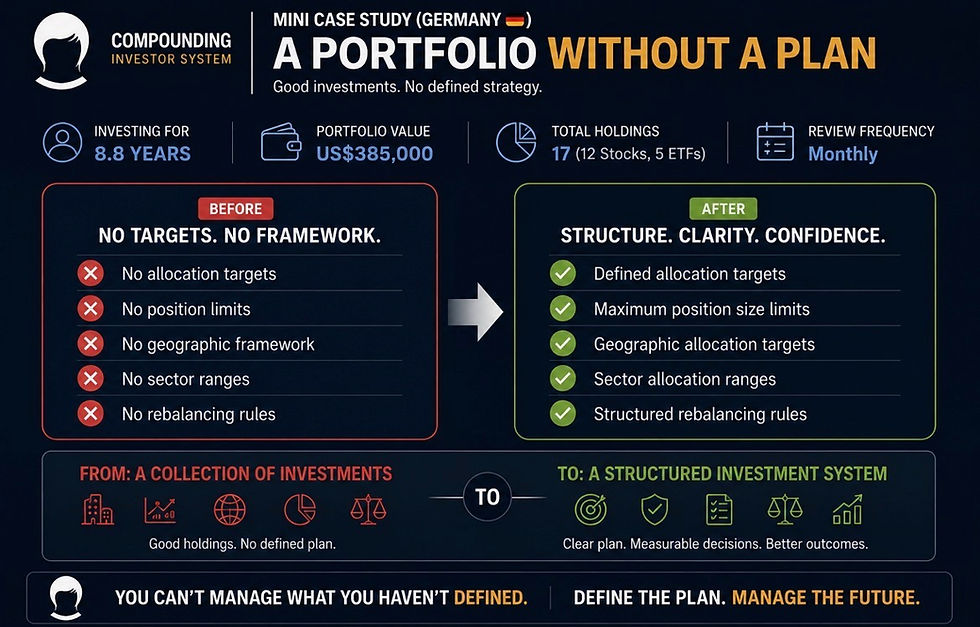
Real Investor Mini Case Study (Germany 🇩🇪): A Portfolio Without a Plan
A German investor in their 40s had been managing their own portfolio for almost nine years. The portfolio was worth approximately US$385,000 and contained:
12 individual companies
5 ETFs
European blue-chip companies
US technology stocks
Global equity funds
The investor reviewed the portfolio every month.
They knew the value of every holding.
They knew which investments had performed well.
During a portfolio review, one simple question was asked:
“What percentage of your portfolio should be invested in Europe?”
The investor paused. They didn’t know.
The same happened when asked:
What is the maximum size any single holding should reach?
How much exposure should you have to North America?
What proportion should be invested in Emerging Markets?
What percentage should be allocated to dividend-paying companies?
At what point would you rebalance?
The answers were always the same.
“I’ve never actually defined that.”
The investor had spent years selecting good investments. They had never designed the portfolio itself.
What the Review Revealed
The portfolio contained:
17 separate holdings
No maximum position size
No geographic allocation framework
No sector allocation ranges
Every investment decision had been sensible in isolation.
But there was nothing linking those decisions into a coherent long-term portfolio strategy. The investor knew what they owned.
They didn’t know what the portfolio was supposed to look like.
The Real Issue
The issue wasn’t:
stock selection
investment quality
The issue was:
the absence of target allocations.
Without predefined targets:
every new investment became a judgement call
portfolio reviews became subjective
rebalancing became guesswork
risk accumulated without clear boundaries
The investor wasn’t managing a portfolio.
They were managing a collection of individual investments.
What Changed
The investor introduced:
Target allocations for individual holdings
Geographic allocation targets
Sector allocation ranges
Quarterly allocation reviews
Structured rebalancing rules
For the first time, every investment decision could be measured against a defined portfolio strategy.
Nothing changed about the companies they owned. Everything changed about how the portfolio was managed.
The portfolio evolved from a collection of investments into a structured investment system.
Hidden Allocation Risks Most Investors Miss
This is why many investors unknowingly create hidden ETF overlap. Multiple funds may appear diversified on the surface while still creating concentrated exposure to the same underlying companies, sectors, or themes.
Even experienced investors often miss:
• ETF overlap
• concentration creep after strong performance
• overexposure to one country or sector
• position sizing becoming distorted over time
• “accidental portfolios” built without structure
This is why allocation should be reviewed monthly — not just when markets fall.
One of the biggest portfolio mistakes is allowing contribution behaviour to reinforce existing winners. Investors often continue adding capital to already overweight positions instead of directing new money toward underweight areas of the portfolio.
Allocation Is Often The First Blind Spot
Most investors assume performance is the problem. Often it isn’t.
The real issue is portfolio structure.
Strong portfolios can produce disappointing outcomes when allocation becomes distorted. The assessment helps identify whether the problem is:
• Allocation
• Benchmarking
• Diversification
• Process Discipline
before those issues compound into larger problems.
How to build a portfolio allocation spreadsheet in Excel (step-by-step)
You don’t need anything fancy. The goal is a simple table that calculates each holding’s value, its percentage of the portfolio, and the variance vs your target allocation.
The goal is NOT to create a complicated spreadsheet.
The goal is:
• clarity
• structure
• visibility
• repeatable decision-making
Even a simple allocation framework is dramatically better than managing a portfolio from memory.
Step 1) List your holdings
Create a table with these columns (starting in row 1):
Holding (name/ticker)
Units/Shares
Price
Value
Target %
Actual %
Variance (Actual % − Target %)
Tip from experience: keep the first version manual. You can automate prices later, but the logic matters more than the data feed.
Step 2) Calculate each holding’s value
In the Value column, multiply Units × Price.
Example formula (if Units is in B2 and Price is in C2):
=B2*C2
Copy it down for all holdings.
Step 3) Calculate total portfolio value
At the bottom of the Value column (or in a separate cell), sum the Value range.
Example:
=SUM(D2:D50)
Name this cell something like TotalValue (optional but helpful).
Step 4) Calculate each holding’s actual allocation %
Actual % is simply holding value ÷ total portfolio value.
Example (if Value is in D2 and total is in D51):
=D2/$D$51
Format the column as Percentage with 1–2 decimals.
Step 5) Add target allocations
In Target %, enter the allocation you want each holding (or bucket) to represent.
Keep it realistic. Targets are guardrails, not predictions. If you’re not sure, start with broad targets (e.g., core ETF 40%, satellite positions 5% each, cash 10%) and refine over time.
Step 6) Calculate variance vs target
Variance tells you what needs attention. It’s Actual % minus Target %.
Example (if Target % is E2 and Actual % is F2):
=F2-E2
Now you can instantly see what’s overweight (positive variance) and underweight (negative variance).

This is exactly how I track allocation and ensure my portfolio stays balanced.
What The Assessment Reveals
Most investors believe allocation is simply about percentages. The assessment looks deeper.
It reveals:
✓ Investor Score
✓ Allocation Discipline
✓ Concentration Risk
✓ Biggest Blind Spot
✓ Personalised Dashboard
For many investors this is the first time they have seen their portfolio measured objectively.
Free assessment • manually reviewed • delivered within 24 hours
Reactive Investor vs Structured Compounder
Reactive Investor | Structured Compounder |
Tracks values | Tracks allocation |
Reviews emotionally | Reviews monthly |
Lets winners run unchecked | Controls drift |
Guesses exposure |
Common mistakes (and how to avoid them)
Not tracking percentages (only £ values): percentages are what control risk.
No target allocation: without targets, you can’t tell drift from intention.
Letting drift compound over time: small drifts become big exposures after a strong run.
If you only take one thing from this post: track allocation monthly (or at least quarterly). The habit matters more than the perfect spreadsheet.
Another common issue is failing to separate portfolio performance from market performance. Investors often believe they are outperforming when they are simply heavily concentrated in a strong-performing sector or style.
Without a system vs with a system
Without a system: you react to price moves, add to what feels good, and only notice concentration after it hurts.
With a system: you can see drift early, rebalance deliberately, and make buys/sells that move you toward your plan and reduce emotional decision making. See the full Compounding Investor System
Assessment → Intelligence Report → System
Most investors try to fix allocation immediately. Structured Compounders follow a different process.
Assessment → identifies weaknesses
Intelligence Report → explains them
System → fixes them
Membership → prevents them returning
That is how portfolio structure improves over time.
Take the free 2-minute Investor Assessment
What a Proper Allocation System Actually Does
Allocation systems also create behavioural discipline. They reduce emotional decision-making by introducing predefined position sizing rules, rebalancing thresholds, and portfolio review processes that operate independently of market sentiment.
A proper allocation system helps you:
• control risk before problems appear
• rebalance logically instead of emotionally
• identify concentration early
• understand true portfolio exposure
• improve long-term compounding consistency
• reduce behavioural mistakes
Most investors think allocation is “spreadsheet admin.”
In reality, it is portfolio risk management.
How this leads into a complete portfolio management system
Allocation is one piece of the bigger picture. A complete portfolio management system also tracks contributions, performance, and decision rules—so you’re not relying on memory or emotion. See related guide How To Track Portfolio Performance
If you want the full setup (allocation + tracking + performance + decision framework), that’s exactly what the Compounding Investor System is built for.
Who this Is for
DIY investors who want a simple, repeatable process
Anyone building a long-term portfolio and trying to avoid concentration risk
Investors who want to rebalance logically instead of emotionally
Who This Is NOT For
This guide is probably not for you if:
you only care whether your portfolio is up today
you are focused on short-term trading
you don’t want to measure performance consistently
you are not interested in long-term compounding
Make this frictionless (so you actually use it)
Keep the spreadsheet to one page.
Update prices on a schedule (e.g., first weekend of the month).
Use conditional formatting on Variance (green underweight, red overweight).
Write down your target allocations once, then stop tinkering.
Hidden Portfolio Blind Spots

What Type Of Investor Are You?
Allocation reveals far more than percentages. It reveals how you make decisions.
The Investor Assessment shows:
✓ Investor Score
✓ Concentration Risk
✓ Dashboard Preview
✓ Recommended Next Step
Assessment → Intelligence Report → System → Membership
Takes Less Than 2-Minutes
FAQ
What is portfolio allocation?
Portfolio allocation is the percentage breakdown of your portfolio across holdings, sectors, geographies, or asset classes. It defines where your capital and risk actually sit.
Why is allocation important?
Allocation controls risk. It prevents one holding, sector, or theme from becoming too dominant without you noticing.
What’s the difference between allocation and diversification?
Diversification means owning multiple investments. Allocation measures how much exposure each investment actually represents.
How often should I review allocation?
Monthly is ideal for most long-term investors. Quarterly is the minimum if you want to control drift properly.
What is allocation drift?
Allocation drift happens when strong-performing holdings gradually become a much larger percentage of the portfolio over time.
Should I rebalance by selling?
Usually, new contributions should be used first to rebalance underweight positions. Selling is typically reserved for significant drift or changing risk profiles.
Can allocation improve returns?
Good allocation can improve risk-adjusted returns because it prevents emotional concentration and improves capital deployment discipline.
Can I track allocation across ISAs and SIPPs together?
Yes. Serious investors should track allocation at total-portfolio level rather than account-by-account.
Explore The Full Framework
The Investor Progression Model White Paper |
This article forms part of the Investor Progression Model — a framework for identifying how investors progress from reactive decision-making to structured long-term compounding. Inside the white paper: ✓ The four investor types ✓ The progression pathway ✓ The five dimensions of investor maturity ✓ How Structured Compounders build repeatable systems ✓ The research behind the Investor Assessment |
⬇ READ THE WHITE PAPER ⬇ |


Comments