1.8 - How to Track Your Portfolio Performance (The Right Way – Not Just “Up or Down”)
- Compounding Investor
- Apr 16
- 6 min read
Most investors think tracking portfolio performance means one thing:
“I’m up 10%.”
It sounds clear, but it’s often misleading—because it ignores time, deposits, withdrawals, and what you actually earned. If you don’t have proper investment performance tracking, you don’t really know how your portfolio is performing—and you can’t confidently improve it.
Who This Guide Is For
This guide is for investors who:
want to understand their real portfolio performance
use Excel or spreadsheets to track investments
are unsure whether their returns are actually good
want to separate contributions from investment returns
care about long-term compounding and disciplined investing
want a repeatable way to measure portfolio progress properly
What You'll Learn | |
Portfolio performance vs portfolio value | So you stop confusing deposits with returns |
Total return vs CAGR | So you understand true compounding |
Why most tracking methods fail | So you avoid misleading performance data |
Why most tracking methods fail | So you can build a repeatable system |
Hidden portfolio blind spots | U |
Benchmarking and contribution tracking | |
Performance tracking in Excel | |
Without vs with a system | So you understand the strategic difference |
Contents
Portfolio performance vs portfolio value
The mistake most investors make
The 2 metrics that actually matter
Hidden performance blind spots
Why most tracking methods fail
What proper performance tracking looks like
What good portfolio performance actually looks like
Real-world example (why CAGR matters)
Where Excel fits
Common performance tracking mistakes
Without vs with a system
Who this is for
Who this is NOT for
FAQ
Related Guides

Quick Portfolio Audit
If you cannot answer these questions quickly, your tracking system probably has blind spots:
What is your portfolio CAGR?
What percentage of your portfolio is in your top 3 holdings?
Are you outperforming the index after adjusting for risk?
How much overlap exists across your ETFs?
Most investors cannot answer these accurately.
Free portfolio health check • manually reviewed • delivered within 24 hours
Portfolio performance vs portfolio value (quick definition)
Portfolio performance = what your investments earned.
Portfolio value = performance + deposits/withdrawals.
The mistake most investors make
The most common “tracking method” is just checking the account value in a broker app and comparing it to last month. That creates 4 big problems:
Only looking at account value (not performance).
Ignoring contributions (adding money can look like “growth”).
Ignoring time (a return over 2 years isn’t the same as over 10).
Confusing gains with performance (price movement ≠ your real return).
Mini example: if you add $500/month, your account can rise even if returns are flat. That’s why you need to separate what you added from what the portfolio earned.
The 2 metrics that actually matter
1) Total Return
Total return answers: “How much did I make overall?”
It measures the overall gain from your investments.
The problem: total return ignores time.
A 50% return over 3 years is very different from a 50% return over 12 years.
That’s why total return alone can create a misleading picture
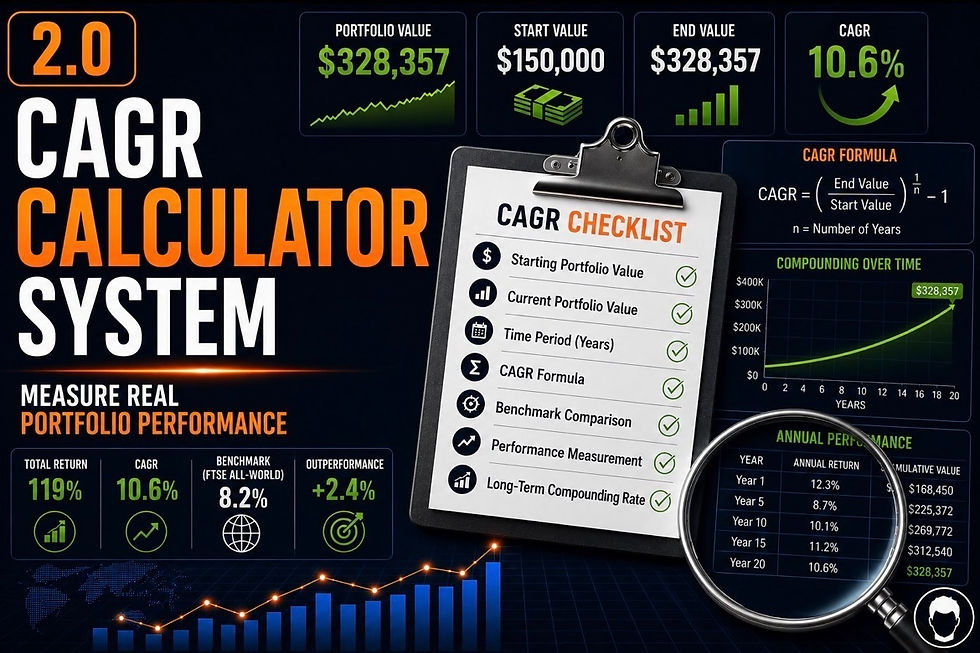
2) CAGR (Compound Annual Growth Rate)
CAGR answers: “How fast did my portfolio compound?”
This is usually the more important metric for long-term investors.
CAGR standardises returns over time so:
portfolios become comparable
strategies become measurable
compounding becomes visible
This is why CAGR becomes the core performance engine inside a structured investing system.
Hidden portfolio performance blind spots
Most investors think they understand performance because they can see whether their portfolio is “up.”
But serious portfolio tracking goes much deeper.
A structured performance review often reveals:
benchmark underperformance
hidden concentration risk
allocation drift
misleading total return figures
inconsistent compounding
Without proper tracking, investors often:
mistake bull markets for skill
underestimate risk
overestimate diversification
fail to identify weakening performance trends
This is why performance tracking should function as a strategic decision-making system — not just a dashboard.
Many investors also fail to distinguish between strong performance and concentrated risk. A portfolio can outperform temporarily simply because one sector, ETF, or individual holding became dominant without the investor fully realising how much risk concentration has increased underneath the surface.
Why most tracking methods fail
Broker apps often don’t calculate properly once you add deposits/withdrawals.
Spreadsheets don’t handle cash flows well unless they’re structured carefully.
No consistency: people track randomly, change methods, or stop when markets drop.
Accurate investment performance tracking needs a repeatable structure.
See related guide Best Portfolio Tracker Excel Template
What good portfolio performance actually looks like
Good investing performance is not:
chasing short-term returns
outperforming during speculative markets
having one exceptional year
Good long-term performance usually looks like:
Consistent CAGR over time
Controlled volatility
Stable allocation discipline
Regular contributions
Benchmark outperformance
Repeatable decision-making
The best investors are often:
more disciplined
more structured
more consistent
— not simply better stock pickers. That is why proper tracking systems matter.

Take the free 2-minute Investor Assessment
What a real portfolio performance system tracks
Metric | Why it matters |
CAGR | Measures long-term compounding |
Total Return | Shows overall gain |
Benchmark Variance | Shows relative performance |
Contribution Tracking | Separates deposits from returns |
Allocation Drift | Identifies hidden concentration risk |
Tracks income compounding | |
Sector Exposure | Shows portfolio concentration |
Geographic Allocation | Reveals regional dependency |
Advanced investors also track benchmark-relative performance, sector concentration, geographic exposure, dividend growth, and position sizing rules to ensure portfolio performance is sustainable rather than dependent on short-term momentum.
Real-world example (why CAGR matters)
Two investors both say: “I made 50%.” But the time period changes everything:
Investor A: +50% over 5 years
Investor B: +50% over 10 years
Same headline gain, very different compounding—CAGR reveals the difference.
Where Excel fits
Excel is powerful for performance tracking—but only if it’s structured to handle contributions/withdrawals, consistent dates, correct formulas, and repeatable reporting. Otherwise, it becomes a fragile portfolio return calculator that breaks the moment real life happens.

The real challenge is not building a spreadsheet — it is building a repeatable investment operating system that remains accurate as contributions, allocation changes, rebalancing decisions, and portfolio complexity increase over time.
Common performance tracking mistakes
Confusing portfolio growth with portfolio performance
Ignoring contributions and withdrawals
Looking only at account balances
Tracking inconsistently across accounts
Measuring returns without benchmarking
Focusing only on winning holdings
Ignoring allocation drift
Using spreadsheets without structure
Many investors also underestimate the behavioural side of performance tracking. Emotional reactions to volatility, inconsistent review processes, and constantly changing strategy frameworks often create more performance leakage than stock selection itself.
Most investors are not actually measuring performance properly — they are estimating it.
Without vs with a system
Without a system | With a system |
Guessing based on account value | Structured CAGR tracking |
Emotional reactions to price moves | Consistent long-term analysis |
Returns separated properly | |
No benchmark comparison | Relative performance visibility |
Hidden concentration risk | Allocation visibility |
Random review process | Repeatable tracking framework |
Who this is for
Investors who aren’t sure what their real performance is.
Anyone relying on broker dashboards for “returns”.
Long-term investors who want consistent, comparable tracking.
Who This Is NOT For
This guide is probably not for you if:
you only care whether your portfolio is up today
you are focused on short-term trading
you do not want to measure performance consistently
you are not interested in compounding
you prefer speculation over structured investing
Hidden Portfolio Blind Spots

Most portfolios contain at least 2–3 of these issues.
Not Sure Where You Stand
Option 1: Take the Investor Assessment
Discover whether you’re a:
Reactive Investor
Lucky Investor
Conservative Compounder
Structured Compounder
Takes Less Than 2-Minutes
Option 2: Get a Free Portfolio Health Check
Receive a personalised review of:
allocation
diversification
concentration
benchmarking
compounding effectiveness
Free portfolio health check • manually reviewed • delivered within 24 hours
FAQ
What’s the difference between portfolio value and portfolio performance?
Portfolio value includes deposits and withdrawals. Portfolio performance measures what your investments actually earned.
Why is CAGR more useful than total return?
Total return tells you how much you made. CAGR tells you how efficiently your portfolio compounded over time.
Why do broker apps often give misleading performance visibility?
Most broker apps focus on balances and short-term movement rather than contribution-adjusted returns, benchmarking, and long-term compounding.
How often should I track portfolio performance?
Monthly is usually ideal. The important thing is consistency.
What should a proper performance tracking system include?
At minimum:
CAGR
total return
historical performance analysis
Is Excel good for tracking portfolio performance?
Yes — but only if the spreadsheet is structured properly. Most spreadsheets become fragile because they are inconsistent and manually maintained.


Comments