1.4 — How to Calculate Portfolio Return in Excel (Without Misleading Yourself)
Updated: 4 days ago
Calculate Your Investment Performance Properly — Not Just Your Portfolio Value
Many investors build an Excel spreadsheet to track their investments.
They record portfolio value.
They update share prices.
They calculate gains and losses.
Some even include dividends. But surprisingly few calculate their true investment return correctly. If your portfolio has grown from $100,000 to $130,000, have you actually earned a 30% return?
Not necessarily.
If you added another $20,000 during that period, your investment performance is very different from someone who reached the same portfolio value without making additional contributions.
This is one of the biggest mistakes private investors make.
They measure portfolio growth rather than investment performance.
Understanding the difference is essential if you want to know whether your investment decisions are actually improving.
In this guide you’ll learn how to calculate portfolio return in Excel, which formulas to use, the common mistakes that distort results and why separating contributions from investment performance is one of the habits that distinguishes Structured Compounders from other investors.

Who This Guide Is For
This guide is for investors who:
• want to calculate portfolio returns accurately
• have made regular contributions over time
• are unsure whether their portfolio growth reflects investment skill or additional savings
• want to measure performance consistently year after year
Most importantly…
This guide is for investors who want to understand how well their portfolio is performing, rather than simply how much it is worth.
What You'll Learn | |
The simplest way to calculate portfolio return in Excel | Measure investment performance correctly using straightforward formulas. |
Why portfolio growth is not the same as investment return | Avoid confusing new contributions with investment gains. |
Build a spreadsheet that reflects reality rather than appearances. | |
Which performance metrics Structured Compounders monitor | Better measurement leads to better long-term decisions. |
How return tracking fits into the Investor Progression Model | Your tracking process often reveals your investor behaviour more clearly than your returns. |
Contents
Why Portfolio Return Is Harder Than It Looks
The Difference Between Portfolio Value and Investment Return
The Basic Portfolio Return Formula in Excel
Worked Excel Example
Common Mistakes Investors Make
What Return Tracking Reveals About Your Investor Type
The Behaviour Gap
Real Investor Case Study
What The Review Revealed
The Real Issue
What Changed
Basic Tracking vs Structured Tracking
Quick Excel Audit
Who This Guide Is For
Who This Guide Is Not For
FAQ
Explore The Full Framework
Related Guides
Final Thought
Why Portfolio Return Is Harder Than It Looks
At first glance, calculating portfolio return appears straightforward.
Your portfolio starts the year at one value. It finishes the year at another.
Subtract one from the other and calculate the percentage increase. Job done. Unfortunately, investing is rarely that simple. Throughout the year you might:
• make monthly contributions
• receive dividends
• buy additional investments
• sell existing holdings
• withdraw cash
Each of these changes your portfolio value. But not all of them represent investment performance. That distinction is critical.
If your portfolio increases by $25,000 because you invested another $20,000 during the year, your investments have not actually generated a $25,000 return.
Most of the growth came from your own savings.
Without separating contributions from investment performance, it becomes impossible to answer one of the most important questions every investor should ask:
“Are my investments performing well, or am I simply adding more money?”
Many investors spend years comparing portfolio balances without ever measuring their true investment return.
As a result, they may believe they are becoming better investors when, in reality, they are simply becoming better savers.
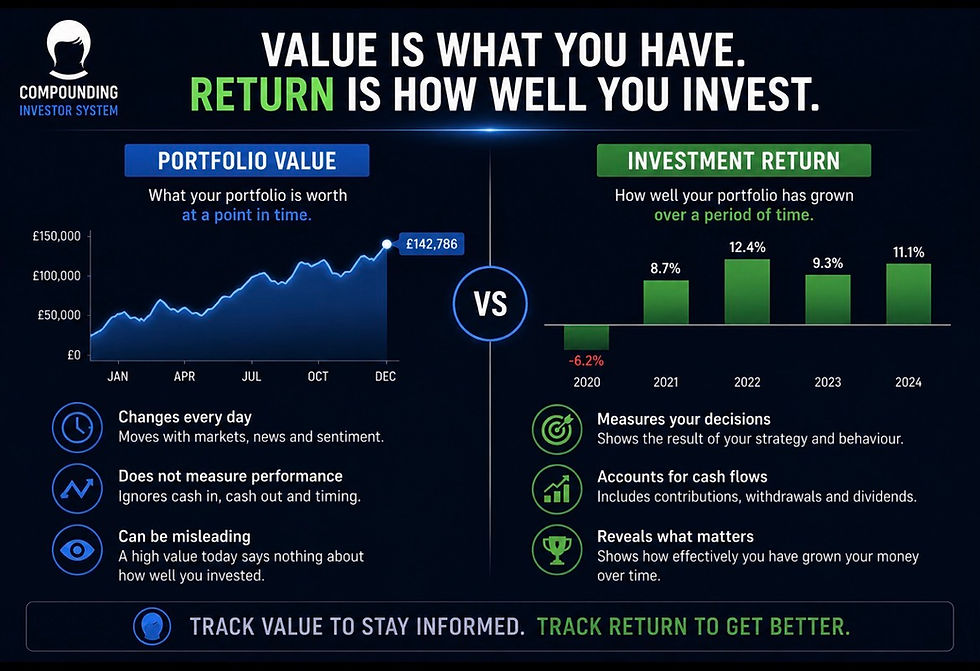
The Difference Between Portfolio Value and Investment Return
Before opening Excel, it helps to understand the difference between these two concepts.
Portfolio Value | Investment Return |
Total value of everything you own today | The growth generated by your investments |
Changes whenever you contribute or withdraw money | Measures how effectively your investments have performed |
Can increase even if investments perform poorly | Removes the effect of additional contributions where possible |
Useful for tracking wealth | Essential for judging investment decisions |
Before You Calculate the Number, Understand the Investor Behind It
Most investors believe they understand how well their portfolio is performing.
Few have ever measured it properly.
The Free Investor Assessment goes beyond simple returns to evaluate how you track, review and improve your investment process.
It identifies:
Your Investor Progression Model classification
Hidden weaknesses in your performance tracking
Whether you separate contributions from investment returns
Blind spots affecting long-term compounding
Practical steps towards becoming a Structured Compounder
Only takes 2-minutes • manually reviewed • delivered within 24 hours
The Basic Portfolio Return Formula in Excel
Once you understand the difference between portfolio value and investment return, calculating a simple portfolio return in Excel becomes straightforward.
The challenge is choosing the right formula for the situation.
If you are measuring performance over a single period with no additional contributions or withdrawals, the calculation is simple.
If you regularly add money to your portfolio, you need a more structured approach.
Let’s start with the basic calculation.
Simple Portfolio Return Formula

This formula measures the percentage increase in your portfolio over the chosen period.
It is quick, simple and perfectly accurate provided no cash has entered or left the portfolio.
Unfortunately, most long-term investors contribute regularly, meaning this formula can quickly become misleading.
Why Contributions Distort Returns
Imagine the following scenario.
Beginning Portfolio | $100,000 |
Additional Contributions | $25,000 |
Ending Portfolio | $135,000 |
At first glance, your portfolio appears to have grown by 35%.
In reality, most of that growth came from your own savings. Your investments generated only $10,000 of growth.
Without separating contributions, Excel cannot tell you whether your portfolio performed well or whether you simply invested more money.
This is one of the most common mistakes made by private investors.
A Better Formula When You Make Contributions
For investors making occasional contributions, a simple adjusted formula provides a much clearer picture.
Adjusted Portfolio Return (%) = (Ending Value - Beginning Value - Contributions + Withdrawals) / Beginning Value
Example

Notice how different the result is.
The portfolio increased by 35%, but the investments themselves produced a return of 10%.
This distinction is essential if you want to judge your investment decisions rather than your saving habits.
Should Dividends Be Included?
Yes.
If dividends remain within the portfolio or are reinvested, they form part of your total investment return.
Ignoring dividends often understates long-term performance, particularly for investors who own dividend-paying companies or income-focused ETFs.
Your total return should normally include:
✓ Capital growth
✓ Reinvested dividends
✓ Realised gains
while excluding:
✗ New contributions
✗ Transfers between accounts
✗ Cash deposits
These are movements of capital, not investment performance.
Worked Excel Example
The table below shows how a simple Excel spreadsheet might calculate annual portfolio return.
Description | Value |
Beginning Portfolio | $150,000 |
Contributions During Year | $18,000 |
Dividends Received | $3,200 |
Ending Portfolio | $186,500 |
Step 1
Calculate investment growth before contributions.
Investment Gain
= Ending Value − Beginning Value − Contributions
= $186,500 − $150,000 − $18,000
= $18,500
Step 2
Calculate return.
Portfolio Return
= $18,500 ÷ $150,000
= 12.3%
Although the portfolio increased by 24.3%, the underlying investments generated 12.3%.
Both figures are useful. Only one measures investment performance.
Which Return Should You Track?
There is no single “correct” performance measure. Each answers a different question.
Metric | Best Used For |
Portfolio Value | Measuring total wealth |
Simple Return | Single periods with no contributions |
Contribution-Adjusted Return | Measuring investment performance during accumulation |
Measuring long-term annualised performance | |
Comparing your results against the market |
Structured Compounders rarely rely on one number. Instead, they build a performance dashboard that combines several complementary measures.
Each metric answers a different question.
Together, they provide a much clearer picture of portfolio quality.
Common Excel Mistakes Investors Make
Many spreadsheets appear sophisticated but still produce misleading conclusions. The most common mistakes include:
Mistake | Why It Matters |
Measuring account value instead of return | Growth may simply reflect additional savings. |
Ignoring contributions | Investment performance becomes overstated. |
Excluding dividends | Total return is understated. |
Mixing multiple investment accounts | Performance becomes fragmented. |
Never benchmarking returns | Good results may simply reflect a rising market. |
None of these errors are difficult to fix. The difficult part is recognising that they exist.
Many investors build increasingly detailed spreadsheets without ever questioning whether the numbers they are calculating actually measure investment performance.
That is where Excel changes from being a record-keeping tool into a decision-making tool.
Once your formulas measure the right things, your reviews become far more meaningful—and that’s the point where tracking starts to improve investing rather than simply documenting it.
Every portfolio tells a story. Do you know what yours says?
Many investors only discover problems after years of investing, when they realise their portfolio has gradually drifted away from what they intended.
The free Investor Assessment helps you identify your investor type and uncover hidden behavioural patterns that can quietly reduce long-term returns, including:
● Portfolio concentration you hadn’t recognised
● Unintentional allocation drift
● Home bias and geographic concentration
● Chasing recent winners instead of following a strategy
● A lack of clear investment objectives
● Decisions driven by instinct rather than a structured process
In just a few minutes, you’ll discover where you currently sit on the Investor Progression Model and receive personalised insights to help you become a more structured long-term investor.
Start the Free Portfolio Assessment to see what your portfolio review could reveal.
Only takes 2-minutes • manually reviewed • delivered within 24 hours
Why Most Excel Portfolios Measure the Wrong Thing
If you search online for an Excel portfolio tracker, you’ll find hundreds of templates. Most include columns for:
Current value
Purchase price
Gain or loss
Percentage return
Some go a little further by adding dividend tracking or asset allocation.
On the surface, they appear comprehensive. But many still fail to answer one fundamental question:
Is your investment process actually improving?
A spreadsheet can calculate numbers perfectly while still encouraging poor decision-making.
For example, two investors might both report a portfolio return of 14%.
Investor A achieved that return through disciplined allocation, consistent benchmarking and quarterly reviews.
Investor B achieved the same return through concentrated positions, performance chasing and good fortune during a strong market.
The numbers look identical.
The quality of the investment process is completely different.
That is why Structured Compounders do not simply track returns. They track the system that produces those returns.
What Return Tracking Reveals About Your Investor Type
One of the biggest differences between investor types is not what they own.
It is how they measure success.
The way you calculate and review portfolio returns often reveals where you sit on the Investor Progression Model.
Investor Type | How They Track Portfolio Returns |
Checks account value after market movements and focuses on short-term gains or losses. | |
Celebrates strong returns but rarely separates investment performance from new contributions or favourable market conditions. | |
Tracks portfolio performance consistently but may benchmark infrequently or overlook allocation drift developing over time. | |
Measures total return, contributions, dividends, CAGR, benchmark performance and allocation as part of a repeatable review process. |
Notice that progression is not about using a more complicated spreadsheet.
It is about asking better questions.
Reactive Investors ask: “Am I up today?”
Lucky Investors ask: “How much has my portfolio grown?”
Conservative Compounders ask: “How did I perform this year?”
Structured Compounders ask: “Why did my portfolio perform this way, and can I repeat it?”
That final question changes everything.
Because long-term investing is not about achieving one good year. It is about building a process capable of producing good outcomes repeatedly.

The Performance Measurement Gap
Many investors believe they are measuring performance accurately.
In reality, they are measuring portfolio growth.
Those are not the same thing.
Imagine an investor who contributes $2,000 every month for ten years. Their portfolio grows from $50,000 to $420,000. That feels like outstanding performance.
But how much of that growth came from:
Regular contributions?
Rising markets?
Dividend reinvestment?
Currency movements?
Individual stock selection?
Without separating these drivers, it becomes impossible to understand whether your investment decisions are improving.
This is what I call the Performance Measurement Gap.
It is the difference between:
Knowing your portfolio value
and
Understanding what created it.
Closing this gap changes the way investors think. Performance stops being something they observe. It becomes something they can analyse, benchmark and improve.
That is why Structured Compounders review performance as part of a complete investment system.
They do not simply ask whether their portfolio is larger.
They ask whether their decision-making is becoming better.
That shift—from measuring outcomes to measuring the quality of the process—is one of the defining characteristics of long-term investing success.
Real Investor Case Study (Canada 🇨🇦): When Portfolio Growth Wasn’t Investment Performance
A Canadian investor from Vancouver had been investing consistently for almost fourteen years. The portfolio contained:
Canadian bank shares
North American equity ETFs
US technology companies
Canadian dividend stocks
Global index funds
Regular monthly contributions
The investor was disciplined. Every month they invested.
They rarely sold.
They reinvested dividends.
They tracked their portfolio in Excel.
By almost every measure, they appeared to be a successful long-term investor.
Their spreadsheet showed the portfolio had grown from approximately $145,000 to $512,000.
They believed their investments had generated an exceptional return. But there was one problem.
The spreadsheet measured portfolio growth.
It did not measure investment performance.
What The Review Revealed
After reviewing the spreadsheet, several issues became clear. Over fourteen years the investor had:
contributed more than $185,000 of additional capital
reinvested almost every dividend payment
never separated contributions from investment returns
never calculated annualised (CAGR) performance
never benchmarked against a global equity index
reviewed portfolio value every month but performance only occasionally
On paper, the portfolio appeared to have produced a return of more than 250%. After adjusting for contributions, the investment return was substantially lower. The portfolio had still performed well.
But the investor had misunderstood why it had grown. Much of the increase reflected disciplined saving rather than exceptional investment performance.
Nothing had gone wrong.
The spreadsheet simply answered the wrong question.

What Would Your Spreadsheet Reveal?
Most investors already have an Excel spreadsheet. The question is whether it measures the right things. Many spreadsheets successfully calculate:
Portfolio value
Individual holding gains
Total profit
Far fewer calculate:
Contribution-adjusted returns
CAGR
Benchmark performance
Allocation changes
Decision quality
Your spreadsheet may already contain all the numbers you need. It may simply be measuring the wrong outcomes.
The Free Investor Assessment helps identify whether your current tracking process reveals your true investment performance—or simply records your portfolio value.
Only takes 2-minutes • manually reviewed • delivered within 24 hours
The Real Issue
The issue was not Excel.
The issue was not the formulas.
The issue was not the investor’s discipline.
The issue was what they were measuring.
For years, the spreadsheet had answered one question extremely well:
“How much is my portfolio worth?”
But it never answered the more important question:
“How well are my investments performing?”
Those are completely different measurements. A larger portfolio can result from:
regular saving
strong investment returns
dividend reinvestment
rising markets
additional capital
Without separating these drivers, performance becomes difficult to interpret. This matters because better investors do not simply monitor wealth.
They monitor how wealth is being created.
That distinction changes the quality of every future investment decision.
What Changed
The investor made surprisingly few changes.
They kept using Excel.
They continued investing every month.
They maintained their long-term investment strategy.
The only difference was what they measured. They introduced:
contribution-adjusted return calculations
annual CAGR tracking
benchmark comparisons
quarterly performance reviews
dividend tracking as part of total return
written notes explaining major portfolio decisions
For the first time, the spreadsheet became more than a record of portfolio values.
It became a decision-making tool.
The investor no longer judged success by looking at the size of the portfolio. Instead, they understood exactly why it had grown.
That shift transformed Excel from a simple tracking spreadsheet into part of a structured investment system.
Basic Tracking vs Structured Tracking
Basic Tracking | Structured Tracking |
Measures portfolio value | Measures investment performance |
Combines contributions with returns | Separates contributions from returns |
Focuses on total gains | Tracks CAGR, total return and benchmarks |
Reviews portfolio value | Reviews investment decisions |
Measures wealth | Measures process quality |
Uses Excel as a record | Uses Excel as a decision system |
Success is judged by account balance | Success is judged by repeatable performance |
Looks backwards | Uses measurement to improve future decisions |
Quick Portfolio Return Audit
Ask yourself these questions.
✓ Can you explain exactly how your portfolio return is calculated?
✓ Do you separate contributions from investment performance?
✓ Do you include dividends within total return?
✓ Do you benchmark your performance against an appropriate index?
✓ Do you calculate CAGR rather than relying on cumulative gains?
✓ Would another investor understand exactly how your spreadsheet measures success?
If several of those answers are No, your spreadsheet may be recording your investments rather than helping you improve them.
That is one of the key differences between tracking a portfolio and building a repeatable investment process.
Who This Guide Is For
This guide is for investors who:
use Excel to track their investment portfolio
want to calculate portfolio returns accurately
make regular monthly contributions
want to separate investment performance from savings
want to benchmark their portfolio properly
are working towards becoming a more structured long-term investor
Whether your portfolio is worth $20,000 or $2 million, measuring returns correctly is one of the foundations of better investing.
Who This Guide Is NOT For
This guide is not for investors looking for:
stock tips
market predictions
trading signals
“hot” investment ideas
shortcuts to outperform the market
It is for investors who believe that better decisions begin with better measurement.
See What Your Portfolio Tracking Is Missing
Many investors spend years improving their spreadsheets.
They add more formulas.
More worksheets.
More charts.
More calculations.
Yet they still cannot answer some of the most important questions about their portfolio.
How much of my growth came from investment performance?
How much came from regular contributions?
Am I outperforming my benchmark?
Is my investment process improving each year?
Am I becoming a more structured investor?
Your spreadsheet may already contain hundreds of rows of data. But data alone does not create insight.
The strongest investors use performance measurement as part of a wider investment system.
The Free Portfolio Assessment helps identify:
whether your portfolio return is being measured correctly
whether contributions are masking true performance
hidden concentration and allocation risks
weaknesses in your current tracking process
where you sit on the Investor Progression Model
Because calculating portfolio return correctly is only the beginning.
Understanding what those returns reveal about your investment process is what creates long-term improvement.
Takes Less Than 2-Minutes
FAQ
What is the easiest way to calculate portfolio return in Excel?
If there are no deposits or withdrawals, use:
(Ending Value − Beginning Value) ÷ Beginning Value
If you make regular contributions, you should adjust for those cash flows to avoid overstating your investment performance.
Should I include dividends when calculating portfolio return?
Yes. Dividends form part of your total return and should normally be included when measuring long-term investment performance, particularly if they are reinvested.
Why does my portfolio keep growing if my investment returns are average?
Because portfolio growth comes from several sources. Your portfolio may increase because of:
regular contributions
market returns
currency movements
capital appreciation
Separating these allows you to understand what is really driving your long-term wealth.
Is Excel good enough for tracking investment performance?
Yes. Excel remains one of the most flexible tools available for long-term investors.
The important factor is not the software itself. It is whether your spreadsheet measures the right metrics consistently.
What is the difference between portfolio growth and portfolio return?
Portfolio growth measures how much your portfolio has increased in value. Portfolio return measures how effectively your investments have performed after accounting for contributions and withdrawals. They answer different questions and should never be treated as the same metric.
Why do Structured Compounders measure more than portfolio value?
Because portfolio value is an outcome. Structured Compounders measure the drivers behind that outcome. They track returns, contributions, dividends, allocation, benchmarking and review discipline to understand whether their investment process is genuinely improving over time.
Explore The Full Framework
The Investor Progression Model White Paper |
This guide forms part of the Compounding Investor Progression Model—a framework designed to help investors move from reactive decision-making towards a repeatable, structured investment process. Inside the white paper you’ll discover: ✓ The four investor types ✓ Why most investors plateau ✓ The five dimensions of investor progression ✓ How Structured Compounders build repeatable systems ✓ The research behind the Investor Assessment |
⬇ READ THE WHITE PAPER ⬇ |
Related Articles
Continue Building Your Portfolio Tracking System
Build a complete Excel portfolio tracker from scratch and understand why effective tracking is the foundation of long-term investing.
Understand why performance tracking is about far more than simply checking whether your portfolio has increased in value.
Learn why annualised returns provide a much more meaningful measure of long-term investment performance than simple averages.
Use a structured review process to identify hidden risks, allocation drift and weaknesses in your investment process.
Final Thought
Most investors believe they are measuring investment performance. In reality, many are simply measuring portfolio growth.
The difference may seem small. It isn’t. A larger portfolio does not automatically mean better investing.
It may reflect years of disciplined saving.
It may reflect a strong market.
It may reflect dividend reinvestment.
Or it may reflect genuinely excellent investment decisions.
Unless you separate those drivers, you cannot know which is true. That is why calculating portfolio return correctly is about much more than learning an Excel formula.
It is about understanding how your wealth has been created.
Structured Compounders recognise that spreadsheets are not simply tools for recording numbers. They are tools for improving decisions.
Every formula should answer a question.
Every review should produce insight.
Every insight should improve the next decision.
Because successful investing is not measured by the size of your spreadsheet.
It is measured by whether your investment process becomes more structured, more repeatable and more effective over time.


Comments