6.0 - Best Portfolio Tracker Excel Template (Free vs Paid + What Actually Works)
- Compounding Investor
- Apr 13
- 9 min read
Updated: Jun 28
Most investors searching for a portfolio tracker Excel template already have some form of spreadsheet. The problem is that most tracking systems don’t actually track the things that matter.
They show:
holdings
prices
account balances
…but fail to measure:
portfolio concentration
CAGR
benchmarking
decision quality
The result is that many investors think they understand their portfolio — when in reality they only understand fragments of it. A proper portfolio tracking system should do more than record numbers.
It should help you:
measure real performance
identify hidden risks
control allocation
improve decision making
compound capital more efficiently over time
This guide explains what actually matters in a portfolio tracker — and the difference between a spreadsheet and a complete portfolio management system.
The problem is rarely the spreadsheet itself.
The problem is that most investors do not know what they should be measuring. They focus on holdings. Structured Compounders focus on visibility.
Before building a better tracker, it helps to understand what type of investor you are and where your biggest blind spots exist.
That is why the Investor Assessment exists.
This guide is for investors who:
use Excel or spreadsheets to track investments
want a cleaner portfolio tracking process
don’t fully trust their current numbers
want to measure performance properly
care about long-term compounding
want to make investment decisions systematically instead of emotionally
Most investors already track something.
The problem is that their tracking system is fragmented, inconsistent, or missing critical information.
What You'll Learn | |
Why most portfolio trackers fail | So you can identify weaknesses in your current setup |
Tracking vs a portfolio system | So you understand why spreadsheets alone are not enough |
What a proper system must include | So you can measure allocation, CAGR, and performance correctly |
Hidden portfolio risks | So you can identify concentration and drift before they become dangerous |
Free vs paid templates | So you understand the difference between tracking and systems |
Without vs with a system | So you can see how structure changes investor behaviour |
Common portfolio blind spots | So you can identify hidden performance leakage |
What type of investor are you | Understand the behaviours and blind spots affecting long-term compounding |
What The Assessment Reveals
Most investors believe they need a better portfolio tracker. The assessment helps identify what is actually missing. It reveals:
✓ Investor Score
✓ Process Quality
✓ Portfolio Visibility
✓ Dashboard Preview
Because building a better tracker is easier once you understand what needs fixing.
Free portfolio health check • manually reviewed • delivered within 24 hours
CONTENTS
Quick portfolio audit
Why most portfolio trackers fail
Tracking vs a portfolio system
What a proper system must include
Hidden portfolio risks most investors miss
Free vs paid templates
Without vs with a system
Why most investors never fix this
Hidden portfolio blind spots
FAQ
Quick Portfolio Visibility Audit
If you cannot answer these questions quickly, your portfolio process probably contains blind spots:
• Do you know your Investor Type?
• Do you know your portfolio CAGR?
• Do you know your largest risk?
• Do you know your sector exposure?
• Do you know your geographic exposure?
• Do you know your biggest compounding weakness?
• Could you explain your investment process?
• Is your portfolio structure intentional?
Most investors know what they own. Far fewer understand what it means.
That is exactly what the Investor Assessment was designed to reveal.
Free 2-minute assessment • manually reviewed • delivered within 24 hours

WHY MOST PORTFOLIO TRACKERS FAIL
Most Excel portfolio trackers fail because they track data — not behaviour.
The spreadsheet may contain:
• holdings
• prices
• account balances
…but still fail to answer the strategic questions that actually drive long-term performance.
Most tracking systems lack:
• benchmarking
• position sizing discipline
• rebalancing structure
The result is that investors often believe they are managing risk properly when in reality they are:
• duplicating exposure across ETFs
• reacting emotionally to markets
• misjudging performance
• making inconsistent allocation decisions
Most spreadsheets track numbers. Very few create clarity.
Most investors assume the problem is missing data. In reality the problem is usually missing visibility.
The assessment helps identify exactly where that visibility is missing.
TRACKER VS A PORTFOLIO SYSTEM
Most investors think they need a portfolio tracker. What they actually need is a portfolio management system. A tracker records information.
A system:
• controls allocation
• measures compounding
• identifies hidden risks
• benchmarks performance
• guides decision-making
• reduces emotional investing
• creates repeatable investment processes
This distinction matters enormously because long-term investment performance is usually driven less by stock selection and more by:
• allocation discipline
• concentration control
• compounding efficiency
That is why many investors underperform despite owning good investments.
Most investors assume the problem is missing data. In reality the problem is usually missing visibility.
The assessment helps identify exactly where that visibility is missing.
WHAT A PROPER SYSTEM MUST INCLUDE
Break this into 4 components:
1. Allocation tracking
% by stock, sector, geography (full guide here)
prevents overexposure
sector exposure
geographic exposure
core vs growth
concentration monitoring
allocation drift detection

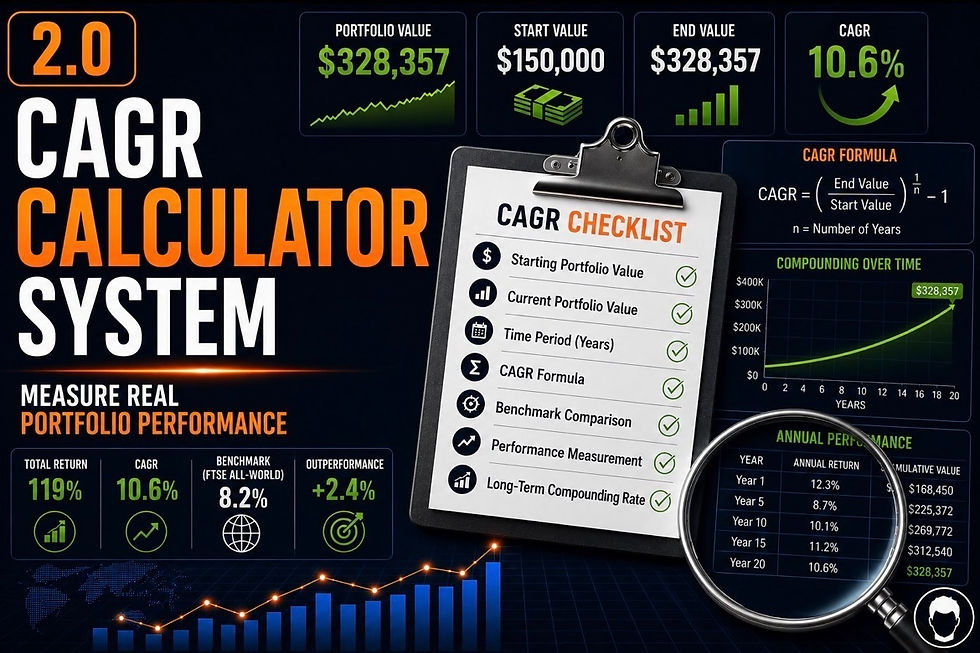
2. Performance tracking (CAGR)
total return is not enough
CAGR shows real compounding (step-by-step explanation here)

Take the free 2-minute Investor Assessment
3. Valuation framework
buy discipline
hold discipline
trimming positions
expected return logic
4. Planning + contributions
where new capital goes
rebalancing logic
maintaining target structure
Assessment Before System
Most investors start with spreadsheets. Structured Compounders start with diagnosis.
Assessment → identifies weaknesses
Dashboard → visualises weaknesses
Intelligence Report → explains weaknesses
System → fixes weaknesses
Membership → maintains progress
The strongest systems are built around investor needs rather than generic templates.
Take the free 2-minute Investor Assessment
Most investors think they need a portfolio tracker. The assessment reveals whether the real issue is:
• concentration
• allocation
• diversification
• process discipline
before they spend time building systems.
HIDDEN PORTFOLIO RISKS MOST INVESTORS MISS
Most portfolios contain structural weaknesses that investors never properly measure.
Common examples include:
• ETF overlap
• concentration risk
• allocation drift
• overexposure to one sector
• weak benchmarking
• fragmented tracking systems
These problems compound slowly over time.
That makes them dangerous because the portfolio can appear healthy while risk quietly increases underneath the surface.
This is exactly why structured portfolio reviews matter.
The strongest investors do not simply track portfolios.
They continuously diagnose them.
Every one of these weaknesses tends to appear more frequently in certain Investor Types.
The assessment identifies which risks are most likely to be affecting your portfolio today.
WITHOUT vs WITH A SYSTEM
Without a System | With a Systemstem |
Guessing allocations | Structured allocation |
Emotional decisions | Measurable performance |
Unclear performance | Consistent decision making |
Allocation drift | Controlled portfolio rebalancing |
ETF overlap | Clear exposure visibility |
Concentration | Diversified risk management |
Planned capital deployment | |
No long term roadmap | Defined CAGR targets |
Assessment → Dashboard → System
Most investors jump straight to tools. Structured Compounders follow a different path.
Assessment → reveals weaknesses
Dashboard → visualises weaknesses
System → fixes weaknesses
Membership → reinforces discipline
This is how investor behaviour improves over time.
WHY MOST PEOPLE NEVER BUILD THIS
Most investors know they should track properly — but they don’t.
Because:
it takes time
it’s harder than expected
they overcomplicate it
So they stay stuck with:
partial tracking
inconsistent decisions
fragmented apps
disconnected spreadsheets
behavioural bias
false sense of diversification
emotional investing
Most investors do not fail because they lack intelligence. They fail because they lack visibility.
The assessment helps provide that visibility before bad habits become embedded.
Real Investor Mini Case Study (Netherlands 🇳🇱): The Portfolio Spread Across Five Apps
A Dutch investor had been investing for almost 11 years. They were organised. Every investment was recorded somewhere. Their portfolio, worth approximately US$540,000, was spread across:
Two brokerage accounts
One pension account
An Excel spreadsheet
A dividend tracking app
A separate watchlist application
The investor believed they had complete visibility. Every platform worked well.
Individually.
A structured portfolio review revealed a different problem.
What The Review Revealed
Each platform answered a different question.
The broker showed current values.
The spreadsheet tracked purchases.
The dividend app monitored income.
The pension platform showed retirement assets.
But nowhere could the investor see the portfolio as a single investment system.
The review identified:
5 different tracking tools
4 separate data sources
No consolidated asset allocation
No single portfolio CAGR
No unified benchmark
No complete view of total portfolio risk
Nothing was actually wrong.
Everything was simply disconnected.
The investor wasn’t managing one portfolio.
They were managing five separate pieces of information.

The Real Issue
The issue wasn’t: Excel
The issue wasn’t: investment apps
The issue wasn’t: broker software
The issue was: fragmentation.
Each tool measured part of the portfolio. None measured the portfolio as a whole.
Without a single source of truth, important relationships between holdings, performance and risk remained hidden.
What Changed
The investor consolidated their tracking into a single structured portfolio management system. For the first time they could see:
Total portfolio value
Overall CAGR
Asset allocation
Benchmark performance
The investments didn’t change.
The visibility did. And with complete visibility came better, faster and more consistent investment decisions.
What The Dashboard Shows
Many investors never see these risks because they review holdings individually.
The dashboard provides a portfolio-level view of:
✓ Investor Score
✓ Diversification Quality
✓ Concentration Risk
✓ Portfolio Structure
✓ Biggest Blind Spot
For many investors this is the first time they have seen their portfolio objectively measured.
Free 2-minute assessment • manually reviewed • delivered within 24 hours
WHO THIS IS FOR
This system is for you if:
you want structure, not guesswork
you track inconsistently (or only via broker)
you want to make decisions based on data
The system is designed to be simple to use — you don’t need advanced Excel skills. If you want a structured way to manage your portfolio without second-guessing decisions, this system gives you everything in one place.
This is especially valuable for investors who suspect something is missing from their current process but cannot clearly identify what it is.
The assessment was designed specifically to answer that question.
What Type Of Investor Are You?
Most investors search for portfolio trackers because they want more control.
The strongest investors seek something deeper.
Visibility.
The Investor Assessment reveals:
✓ Investor Type
✓ Process Quality
✓ Compounding Strengths
✓ Compounding Weaknesses
✓ Dashboard Preview
✓ Recommended Next Step
Assessment
→ Dashboard
→ Intelligence Report
→ System
→ Membership
Takes Less Than 2-Minutes
FREE VS PAID TEMPLATES
Free templates
Pros:
quick to start
no cost
Cons:
incomplete
inconsistent
no decision framework
Structured system (what you want)
Pros:
everything in one place
repeatable process
removes emotion
7. FAQ
What is a portfolio tracker?
A portfolio tracker is a tool used to monitor your investments — including performance, allocation, and progress over time. At a basic level, it shows what you own and how prices have changed.
But a proper portfolio tracker goes further: it calculates real returns (like CAGR), shows where your capital is allocated (by stock, sector, and geography), and helps guide decisions on what to buy, hold, or rebalance.
Most “trackers” are just spreadsheets. A structured portfolio tracking system turns data into clear, usable insights.
Is Excel good for tracking investments?
Yes — but only if it’s structured properly. See portfolio tracking guide.
Excel is a powerful tool for tracking investments because it allows you to customise calculations, track performance over time, and build a system tailored to your portfolio. The problem isn’t Excel — it’s how most people use it.
Basic spreadsheets often track prices but fail to measure real performance (like CAGR), allocation, or decision-making frameworks.
With the right structure, Excel becomes a complete portfolio management system. Without it, it’s just a list of numbers.
What should a portfolio spreadsheet include?
A good portfolio spreadsheet should include four core components:
• Allocation tracking – see your exposure by stock, sector, and geography to manage risk
• Performance tracking (CAGR) – measure real annualised returns, not just price changes
• Valuation framework – understand whether holdings are overvalued or undervalued
• Planning & contributions – track new investments, rebalancing, and future strategy
Most free templates only cover basic tracking. A structured system brings all of this together, giving you a clear, consistent way to measure performance and make better investment decisions.
What is the best Excel portfolio tracker?
A good tracker should include allocation, performance (CAGR), valuation, and planning — not just holdings.
Is Excel good for tracking investments?
Yes — if structured correctly. The problem isn’t Excel — it’s the lack of a system.
Can I use a free template?
Yes, but most lack the structure needed for consistent decision-making.
Explore The Full Framework
The Investor Progression Model White Paper |
This article forms part of the Investor Progression Model — a framework for identifying how investors progress from reactive decision-making to structured long-term compounding. Inside the white paper: ✓ The four investor types ✓ The progression pathway ✓ The five dimensions of investor maturity ✓ How Structured Compounders build repeatable systems ✓ The research behind the Investor Assessment |
⬇ READ THE WHITE PAPER ⬇ |


Comments