2.1 – CAGR vs Average Return
Updated: 7 days ago
Most investors believe they understand their investment returns.
They know:
how much their portfolio has increased
what they earned last year
whether they made money
What many investors do not realise is that the way they measure returns can dramatically change the conclusions they draw and also explain why sometimes your returns feel wrong..
A portfolio showing an average return of 12% may not have compounded at 12%.
In some cases, the difference can be substantial.
This is one of the most common performance measurement mistakes investors make.
Understanding the difference between CAGR and average return is essential if you want to evaluate performance accurately and make better long-term investing decisions.

Who This Guide Is For
This guide is for investors who:
want to understand their true portfolio performance
already track returns but want greater accuracy
want to improve long-term compounding
compare portfolios, funds or benchmarks
want to avoid common performance measurement mistakes
are building a structured investing process
want to understand what type of investor they are becoming
Most importantly:
This guide is for investors who want to measure what actually matters.
What You'll Learn | |
CAGR vs Average Return | Understand the critical difference |
Performance Measurement | Learn which metric investors should use |
Compounding Mathematics | See how wealth actually grows |
Investor Progression Model | Understand how different investors measure returns |
Real Investor Example | See how incorrect measurement creates false confidence |
Learn how Structured | |
Contents
Why Most Investors Misunderstand Returns
The 4 Types of Investor
Quick Return Accuracy Audit
CAGR vs Average Return Explained
Why Average Return Can Be Misleading
Real Investor Mini Case Study
The Real Issue
What Changed
Conservative Compounder vs Structured Compounder
Why Structured Investors Measure CAGR
Who This Is For
Who This Is Not For
FAQ
Related Guides
Final Thought
Why Most Investors Misunderstand Returns
Most investors focus on whether their portfolio made money.
Few focus on how that money was generated.
Consider two investors.
Investor A experiences:
+30%
-20%
+26%
Investor B experiences:
+12%
+12%
+12%
Both investors achieve an average annual return close to 12%.
However, their wealth outcomes are very different.
Why?
Because compounding does not occur using average returns. Compounding occurs using CAGR. The further returns fluctuate, the larger the gap becomes.
This is why investors can believe they are achieving strong performance while their portfolio compounds at a much lower rate.
Understanding real investment performance is one of the foundations of effective long-term investing.
The 4 Types of Investor
Most investors eventually fall into one of four categories. The goal is not simply generating returns. The goal is building a repeatable system that produces sustainable long-term compounding.
Reactive Investor
Measures:
account balance
recent performance
Often ignores:
benchmarking
CAGR
long-term analysis
Lucky Investor
Measures:
gains
Often confuses:
luck with skill
market tailwinds with investing ability
Conservative Compounder
Measures:
portfolio performance
dividends
portfolio value
Often misses:
benchmarking
CAGR accuracy
compounding efficiency
Structured Compounder
Measures:
CAGR
benchmark CAGR
total return
risk-adjusted performance
compounding efficiency
The key difference is not intelligence.
It is measurement.

Quick Return Accuracy Audit
Answer these questions honestly.
✓ Do you know your portfolio CAGR?
✓ Do you know your benchmark CAGR?
✓ Do you know your total return over the last five years?
✓ Are dividends included in your calculations?
✓ Do you understand the difference between CAGR and average return?
✓ Could you explain why CAGR is lower than average return?
✓ Have you benchmarked performance against an appropriate index?
✓ Do you track long-term compounding rather than short-term gains?
✓ Do you know whether your portfolio is outperforming after accounting for volatility?
✓ Could you explain your actual annualised return in under two minutes?
If several questions concern you, your understanding of portfolio performance may not be as accurate as you think.
Most investors estimate performance.
Structured investors measure it.
Discover Your Investor Type
Many investors are surprised by what a structured review reveals.
Take the free Investor Assessment to discover:
your investor type
hidden portfolio weaknesses
opportunities to improve long-term compounding
Only takes 2-minutes • manually reviewed • delivered within 24 hours
CAGR vs Average Return Explained
Average return is simply the arithmetic average of annual returns.
If returns are:
Year 1: +20%
Year 2: -10%
Year 3: +20%
Average Return:
(20 - 10 + 20) ÷ 3 = 10%
The average return is 10%.
However, the portfolio did not compound at 10%.
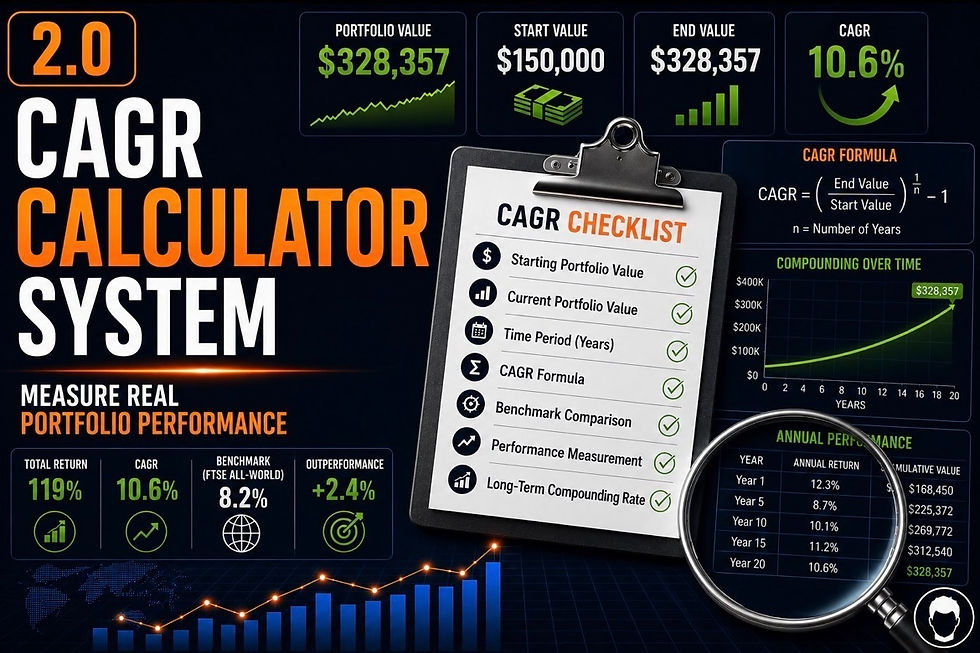
To calculate actual wealth growth we use CAGR.
CAGR measures:
The annual rate at which wealth actually compounded over time.
This is why CAGR is generally the more useful metric for long-term investors.
Average return describes yearly outcomes.
CAGR describes wealth creation.
Why Average Return Can Be Misleading
Average return assumes each year exists independently. Investing does not work that way.
Returns build upon previous returns. Losses have a disproportionate impact on future growth.
For example:
Year | Return |
1 | +50% |
2 | -50% |
Average Return = 0%
Many investors assume this means they broke even.
They did not.
$100 becomes:
$150
Then:
$75
The average return was 0%.
The CAGR was negative. The investor lost money.
This simple example explains why average return often creates false confidence.
Take the free 2-minute Investor Assessment
I think 2.1 deserves a stronger case study than the current one because it’s one of your cornerstone articles. The lesson should not be simply “expected CAGR vs actual CAGR.” Instead, it should show why average return creates false confidence—which is the entire point of the article.
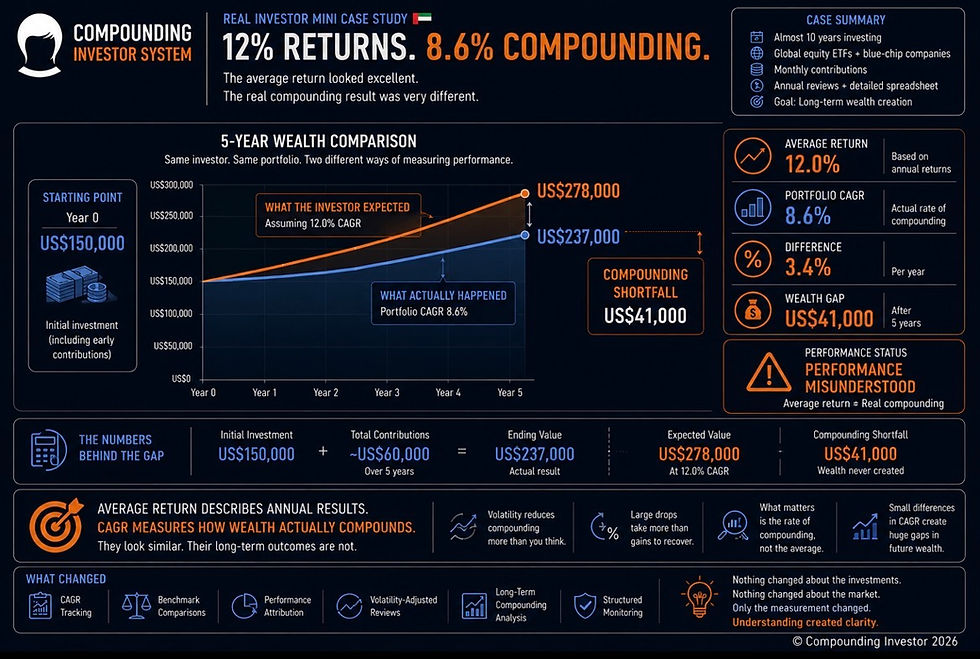
Real Investor Mini Case Study (United Arab Emirates 🇦🇪): When 12% Returns Produced Disappointing Wealth
A UAE investor discovered that average returns and real compounding were telling two completely different stories. A UAE investor had been investing consistently for almost ten years.
The objective was straightforward:
Build long-term wealth through a diversified portfolio of global equity funds and high-quality companies.
The portfolio contained:
global equity ETFs
US and European blue-chip companies
regular monthly contributions
Each year the investor calculated their average annual return. Over five years the calculation showed an average return of approximately 12.0% per year.
The investor concluded the portfolio was compounding at around 12%.
Performance appeared excellent.
A structured performance review revealed a very different picture.
What The Analysis Revealed
A CAGR analysis showed that annual volatility had significantly reduced long-term compounding. The review identified:
Average Annual Return: 12.0%
Actual Portfolio CAGR: 8.6%
Difference: 3.4 percentage points per year
Portfolio Value After Five Years: US$237,000
Expected Value (assuming 12% CAGR): US$278,000
The portfolio had generated positive returns every year on average.
But the investor had confused average yearly performance with the actual rate at which wealth compounded.
The difference wasn’t mathematical.
It represented tens of thousands of dollars of expected wealth that never materialised.
The Real Issue
The issue was not: investment selection
The issue was not: portfolio discipline
The issue was not: positive returns
The issue was: measurement.
The investor measured average annual returns.
They never measured the annual rate at which their wealth actually compounded.
Those two numbers looked similar.
Their long-term outcomes were not.
What Changed
The investor introduced:
CAGR tracking
annual performance attribution
long-term compounding analysis
Nothing changed about the investments.
Nothing changed about the market.
The only thing that changed was how performance was measured.
Once the investor stopped focusing on average returns and started measuring actual compounding, every portfolio review became more objective—and every long-term decision became more informed.
Discover Your Investor Type
Many investors never identify the weaknesses affecting their long-term results.
A structured review helps uncover:
performance blind spots
compounding weaknesses
Are you a Structured Compounder? Find out - take the Free Assessment

Free 2-Minute Assessment
Free assessment • manually reviewed • delivered within 24 hours
Conservative Compounder vs Structured Compounder
Conservative Compounder | Structured Compounder |
Review performance | Measures performance |
Uses headline returns | Uses CAGR |
Focuses on gains | Focuses on compounding |
Assumes performance is good | Verifies oerformance |
Monitors portfolio value | Monitors compounding efficiency |
Structured process | Optimised process |
Why Structured Investors Measure CAGR
Structured Compounders understand something many investors miss.
Positive returns do not automatically mean good performance.
They therefore monitor:
CAGR
allocation
concentration
compounding efficiency
Over time this creates:
better decisions
better expectations
greater confidence
stronger long-term outcomes
The goal is not simply making money.
The goal is understanding how wealth compounds.
Free Portfolio Health Check
Receive a personalised review of:
portfolio CAGR
benchmark comparison
allocation structure
compounding efficiency
You’ll also discover where you currently sit within the Investor Progression Model and what may be holding your portfolio back.
Takes Less Than 2-Minutes
Who This Is For
This guide is for:
long-term investors
ETF investors
dividend investors
ISA investors
pension investors
investors building a structured process
investors seeking better performance measurement
investors wanting sustainable compounding
Who This Is NOT For
This guide is not designed for:
day traders
speculative investors
investors focused solely on short-term price movements
investors unwilling to benchmark performance
investors looking for stock tips
FAQ
Is CAGR better than average return?
For long-term investing, yes.
CAGR measures how wealth actually compounded over time.
Average return simply measures the arithmetic average of annual returns.
Can two investors have the same average return but different outcomes?
Yes.
Volatility affects compounding.
Two portfolios can report identical average returns while producing very different wealth outcomes.
Why is CAGR usually lower than average return?
Because volatility reduces compounding efficiency.
Losses require larger gains to recover.
CAGR accounts for this reality.
Should I benchmark CAGR?
Yes.
A portfolio CAGR has little meaning without context.
Benchmarking helps determine whether performance is genuinely strong.
What is a good portfolio CAGR?
That depends on risk, time horizon and benchmark.
Many successful investors focus on sustainable long-term returns rather than maximising short-term gains.
Do professional investors use CAGR?
Yes.
Annualised returns and CAGR are standard performance metrics used throughout the investment industry.
Explore The Full Framework
The Investor Progression Model White Paper |
This article forms part of the Investor Progression Model — a framework for identifying how investors progress from reactive decision-making to structured long-term compounding. Inside the white paper: ✓ The four investor types ✓ The progression pathway ✓ The five dimensions of investor maturity ✓ How Structured Compounders build repeatable systems ✓ The research behind the Investor Assessment |
⬇ READ THE WHITE PAPER ⬇ |
Related Articles
Continue Your Portfolio Review
Learn how to calculate CAGR accurately using Excel.
Separate skill from luck and measure performance correctly.
Learn why many investors misunderstand their actual performance.
Understand the principles behind sustainable long-term compounding.
Final Thought
Most investors do not misunderstand investing. They misunderstand returns. Average return tells you what happened in individual years.
CAGR tells you how wealth actually compounded.
The difference matters.
Because long-term investing is not about isolated annual returns. It is about the rate at which capital compounds over decades.
The investors who achieve the best long-term results are rarely those who know the most.
They are often those who measure the right things.
And better measurement is often where better compounding begins.


Comments