9.0 - How to Build a Portfolio That Compounds Consistently (Using a Structured System)
Updated: 6 days ago
Most investors never build portfolios that compound properly because they focus on individual investments instead of building a structured system.
They:
• chase performance
• track returns inconsistently
• fail to benchmark performance properly
• never develop a repeatable investment process
Over time this creates fragmented portfolios with unclear strategy, inconsistent decision-making, and hidden risks that quietly damage long-term returns.
The investors who compound successfully over decades usually do not have access to better predictions.
They simply operate with:
• clearer portfolio architecture
• stronger allocation discipline
• better performance measurement
• consistent review processes
Most investors believe the solution is finding better investments.
Structured Compounders focus on something different.
They focus on building a better process.
Before improving a portfolio, it helps to understand what stage of investor development you have reached.
That is why the Investor Assessment exists.

Who This Guide Is For
This guide is for investors who:
• already use Excel or spreadsheets to track investments
• want to compound capital consistently over time
• care about portfolio structure and allocation
• want to measure real investment performance properly
• want to reduce emotional decision-making
• are building long-term portfolios rather than short-term trades
• want a repeatable investment process rather than random stock picking
Most investors already track investments.
Very few build a structured investment operating system.
What You'll Learn | |
Why most investors fail to compound | So you can identify the structural weaknesses damaging long-term returns |
What compounding actually looks like | So you understand how small CAGR differences create major long-term outcomes |
So you understand how small CAGR differences create major long-term outcomes | |
Why CAGR matters | So you can measure real annualised performance |
Hidden portfolio risks | So you can identify concentration and allocation drift |
Without vs with a system | So you can understand how structure changes outcomes |
Investment operating systems | So you can build repeatable long-term processes |
What stage of investor development you are currently operating at | Understand what is preventing investor progression towards becoming a Structured Compounder |
Contents
Why most investors never build compounding portfolios
What compounding actually looks like
Quick portfolio audit
What a structured portfolio looks like
Why CAGR sits at the centre of the system
Hidden portfolio blind spots
Why most portfolio tracking systems fail
Without vs with a structured system
Who this is for
FAQ
Why Most Investors Never Build a Compounding Portfolio
Most investors do not fail because they choose terrible investments.
They fail because they never build a structured system around:
allocation
diversification
benchmarking
review processes
behavioural discipline
Instead, portfolios evolve randomly over time.
New positions get added emotionally.
Winning positions become oversized.
Sector exposure drifts.
Performance gets measured inconsistently.
Eventually the investor owns a collection of investments — but not a coherent portfolio strategy.
This is why many investors experience years of activity without developing a portfolio that compounds efficiently over long periods.

Small differences in annual return compound into massive differences over time — which is why structure and measurement matter.
Quick Structured Compounder Audit
If you cannot answer these questions quickly, your portfolio probably contains hidden weaknesses:
• Do you know your Investor Type?
• Do you know your portfolio CAGR?
• Do you know your biggest compounding weakness?
• Do you know your largest concentration risk?
• Do you know where allocation drift exists?
• Do you know whether you are outperforming?
• Do you know what stage of investor development you have reached?
• Could somebody else follow your investment process?
Most investors focus on holdings.
Structured Compounders focus on process.
The Investor Assessment reveals the difference.
The assessment reveals:
✓ Investor Type
✓ Process Quality
✓ Portfolio Structure
✓ Compounding Strengths
✓ Biggest Weakness
✓ Personalised Dashboard
Take the Free 2-Minute Assessment
The Problem Most Investors Have
Most investors:
Track returns inconsistently
Don’t measure performance annually
Don’t compare across holdings
Don’t know if they’re on track
The result:
👉 No discipline
👉 No compounding strategy
Most investors believe they have a portfolio problem.
The assessment often reveals they have a process problem.
The portfolio is usually the symptom.
The investor behaviour is usually the cause.
What a Structured Portfolio Looks Like

Structured investors do not simply focus on stock picking.
They build a repeatable investment architecture designed to:
• manage risk
• control allocation
• improve decision-making
• measure compounding properly
• reduce behavioural mistakes
• maintain long-term consistency
The portfolio becomes a system — not just a list of holdings.
Why Investor Type Matters
Reactive Investors own portfolios.
Structured Compounders operate systems.
The difference is rarely intelligence.
The difference is process maturity.
The assessment helps identify where you currently sit on that progression journey.
Portfolio Architecture
Core vs Growth allocation
Sector balance
Geographic exposure
allocation targets
diversification logic
core vs growth framework
portfolio drift monitoring
Strong long-term portfolios are usually built around allocation discipline rather than constant stock selection. Without a defined structure, portfolios naturally drift toward concentration and emotional decision-making.
Allocation discipline is one of the clearest indicators of Investor Type. The assessment frequently identifies allocation weaknesses before investors notice them themselves.
Risk Management
Volatility (beta)
Position sizing
Concentration limits
ETF overlap
benchmark volatility
risk-adjusted returns
downside protection
Many investors believe they are diversified because they own multiple ETFs or funds, when in reality they may still be heavily concentrated underneath the surface.
Many Lucky Investors appear diversified.
The assessment often reveals hidden concentration underneath the surface.
Entry Discipline
Valuation vs history
Buy zones vs overvaluation
Market positioning
valuation discipline
emotional buying
position scaling
contribution timing
Structured systems reduce emotional investing by creating predefined decision frameworks instead of relying on instinct during periods of volatility.
Emotional investing is one of the strongest predictors of long-term underperformance.
The assessment was specifically designed to identify behavioural weaknesses before they become expensive mistakes.
Performance Tracking
CAGR (not just total return)
Portfolio vs plan
Long-term progress
benchmark comparison
holding-level CAGR
Proper performance tracking should separate investment skill from simple capital contributions. Otherwise portfolios can appear to perform well despite weak compounding efficiency.
Most investors never calculate portfolio-level CAGR properly across all holdings, contributions, and time periods.
That makes it extremely difficult to know:
• whether the portfolio is actually compounding efficiently
• whether risk is increasing underneath the surface
• whether returns are outperforming relevant benchmarks
This is exactly why structured performance measurement matters.
Many investors discover through the assessment that performance visibility is far weaker than they believed.
Good investing is difficult without accurate measurement.
Real Investor Mini Case Study (Argentina 🇦🇷) : The Portfolio Built for Survival, Not Compounding
An Argentine investor had been investing for more than twelve years in an economy that structurally undermined long-term compounding.
Their original goal was simple:
Protect wealth from inflation, currency weakness and domestic economic instability.
The portfolio contained:
16 US-listed companies
4 global ETFs
regular monthly investments in US dollars
occasional Argentine equities
an international brokerage account
On paper, the portfolio looked sensible.
It had grown to approximately US$420,000.
It had protected purchasing power.
It had avoided the worst effects of domestic currency weakness.
The investor believed the portfolio was working.
A structured portfolio review revealed something different.
What The Review Revealed
The portfolio had been built around protection. It had not been built around repeatable compounding. The review identified:
no target allocation
no benchmark CAGR tracking
no structured review schedule
no clear contribution rules
no documented process for deciding what to buy next
The investor had made several sensible decisions. But most decisions had been shaped by external conditions:
currency movements
political headlines
fear of holding too much local exposure
desire to preserve capital in US dollars
The portfolio was not reckless. It was not poorly invested.
But it was still reactive.
The investor had built a portfolio to defend wealth.
They had not yet built a system to compound it consistently.

The Real Issue
The issue was not: lack of discipline
The issue was not: poor investment choices
The issue was not: economic uncertainty
The issue was: process quality.
The investor had learned to react intelligently to difficult conditions.
But reacting intelligently is not the same as operating a repeatable investment system.
Without structure, every new decision still depended too much on the latest economic pressure.
What Changed
The investor introduced:
target allocation ranges
written buy criteria
benchmark CAGR tracking
portfolio health monitoring
Nothing changed about Argentina’s economic uncertainty.
Nothing changed about global market volatility.
Everything changed about how decisions were made.
The portfolio moved from:
defensive wealth protection
towards:
structured long-term compounding.
The investor stopped asking only:
“How do I protect my wealth?”
They started asking:
“How do I build a system that compounds through uncertainty?”
Discover Your Investor Type
Most investors believe they need a better portfolio. Often they need a better process.
The assessment identifies:
✓ Investor Type
✓ Process Strengths
✓ Process Weaknesses
✓ Compounding Blind Spots
✓ Recommended Next Step
before any portfolio changes are made.
Take the free 2-minute Investor Assessment
Why CAGR Is Central to This System
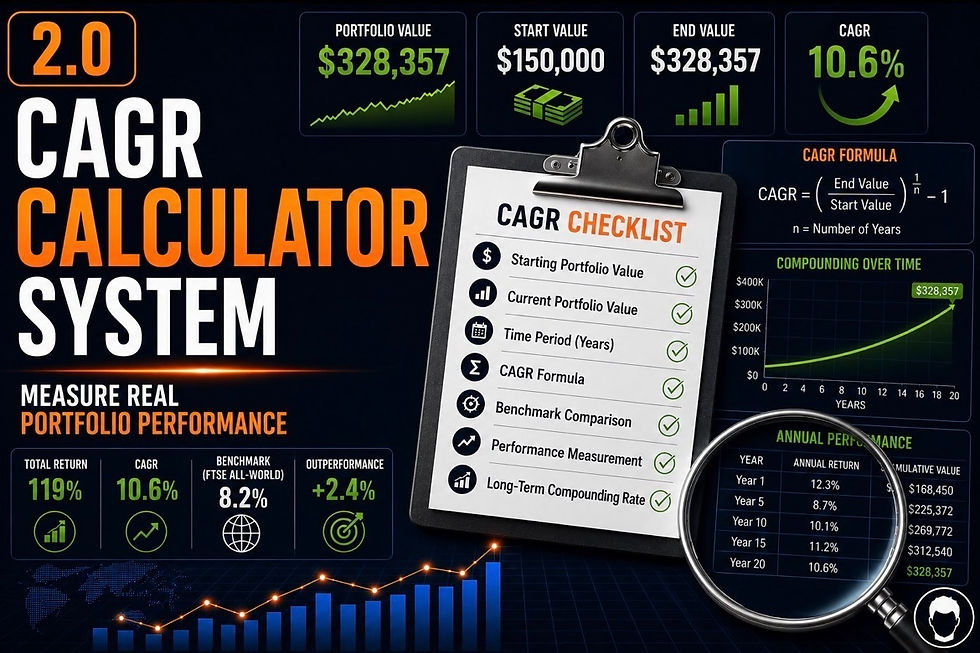
CAGR (Compound Annual Growth Rate) is the metric that ties everything together.
It answers one question:
CAGR acts as the performance engine inside a structured investment system because it converts uneven annual returns into one consistent annualised figure.
This makes it possible to:
• compare holdings consistently
• measure portfolio-level performance
• benchmark against target returns
• identify weak compounding efficiency
• compare different time periods fairly
Without CAGR, investors often confuse growth with compounding.
This is one of the most common weaknesses identified during the assessment.
Many investors track growth.
Structured Compounders track compounding efficiency.
With CAGR, performance becomes measurable, comparable, and repeatable.
Quick CAGR Explanation
Total return tells you how much you made.
CAGR tells you how efficiently you made it.
Example:
Investment A: +50% over 5 years
Investment B: +50% over 2 years
Same return — very different performance.
How to Calculate CAGR
You only need 3 inputs:
Starting value
Ending value
Number of years
Formula: CAGR = (Ending Value / Starting Value) ^ (1 / Years) – 1

Most portfolios contain at least a few structural weaknesses that are invisible without a proper review framework.
The objective is not perfection.
The objective is improving:
• clarity
• consistency
• allocation discipline
• compounding efficiency
Common Mistakes
Confusing CAGR with total return
Using inconsistent time periods
Not applying it across all holdings
This makes comparisons meaningless.
Portfolio Structural Weaknesses
Most portfolios contain structural weaknesses that investors never fully identify.
Common examples include:
• ETF overlap
• concentration risk
• allocation drift
• inconsistent benchmarking
• weak review processes
• hidden sector overexposure
These problems compound slowly over time.
That makes them dangerous because the portfolio can appear healthy while risk quietly increases underneath the surface.
Most investors do not need more stock ideas.
They need more portfolio clarity.
The assessment was built specifically to provide that clarity. Most portfolios contain:
✓ allocation weaknesses
✓ benchmarking weaknesses
✓ concentration weaknesses
✓ process weaknesses
✓ behavioural weaknesses
The assessment identifies which are affecting you.
Without vs With a System
Without a System | With a Systemstem |
Random portfolio construction | Defined portfolio structure |
Emotional allocation decisions | Structured allocation discipline |
Guessing performance | Portfolio-level CAGR tracking |
Multiple disconnected spreadsheers | Unified investment operating system |
Controlled exposure managment | |
No benchmark comparison | Risk-adjusted performance measurement |
Reactive investing | Repeatable decision making process |
Inconsistent reviews | Structured portfolio review framework |
Assessment Before System
Most investors try to build a system immediately. Structured Compounders follow a different path.
Assessment → identifies weaknesses
Dashboard → visualises weaknesses
Intelligence Report → explains weaknesses
System → fixes weaknesses
Membership → reinforces discipline
This is how long-term improvement becomes repeatable.
Why Most Investors Don’t Do This
Most investors do not avoid structured investing because it is ineffective.
They avoid it because:
• it initially feels manual
• most broker apps lack proper portfolio analytics
• spreadsheets become fragmented over time
• emotional investing feels easier
• consistent review processes require discipline
The result is that many portfolios become collections of disconnected decisions rather than coherent long-term investment systems.

Most investors do not fail because they lack intelligence. They fail because they lack visibility.
The assessment helps provide that visibility before weak habits become embedded.
Why Most Portfolio Tracking Systems Fail
Most portfolio tracking systems fail because they were designed to track prices — not investment behaviour.
They often fail to measure:
• allocation drift
• contribution distortion
• benchmark-relative returns
• ETF overlap
• concentration risk
• risk-adjusted performance
As portfolios become larger and more complex, these blind spots become increasingly dangerousThe Alternative (System Positioning)
A structured investing system should function like an investment operating system.
It should:
• centralise portfolio tracking
• enforce allocation discipline
• measure compounding properly
• benchmark performance consistently
• reduce behavioural mistakes
• improve long-term decision quality
The goal is not prediction. The goal is repeatable long-term compounding.
Most systems measure portfolios.
The assessment measures investors.
That distinction matters more than most people realise.
Most investors focus on improving returns. Structured Compounders focus on improving process quality.
The assessment helps identify:
• where you are today
• where you need to improve
• what is preventing progression
The portfolio improves because the investor improves.
Who This Is For
You want to track performance properly
You already use spreadsheets but lack structure
You want clarity across your portfolio
Who This Is NOT For
investors focused purely on short-term trading
people who only care about daily price movement
investors unwilling to track performance consistently
speculative traders seeking rapid gains
people uninterested in long-term portfolio management
Hidden Portfolio Blind Spots

Most portfolios contain at least 2–3 of these issues.
Most investors assume their biggest weakness is stock selection. The assessment often reveals the real issue is process quality.
What Type Of Investor Are You?
Most investors want a portfolio that compounds consistently.
Structured Compounders build the behaviours that make consistent compounding possible. The Investor Assessment reveals:
✓ Investor Type
✓ Investor Score
✓ Process Quality
✓ Compounding Strengths
✓ Compounding Weaknesses
✓ Dashboard Preview
✓ Recommended Next Step
Assessment
→ Dashboard
→ Intelligence Report
→ System
→ Membership
Takes less than two minutes.
FAQ
What is CAGR in investing?
CAGR is the annualised return that shows how your investment grew over time.
How do I calculate CAGR in Excel?
=(Ending Value / Starting Value) ^ (1 / Years) – 1
Is CAGR better than total return?
Not always — but it’s better for comparing performance across time.
This content is for informational purposes only and does not constitute financial advice. It is intended to demonstrate a structured approach to portfolio management and performance tracking.
What is a good long-term CAGR for an investment portfolio?
A long-term CAGR of 8–12% is generally considered strong for a diversified equity portfolio. The most important factor is not chasing extreme returns, but achieving consistent compounding over long periods while controlling risk and avoiding major behavioural mistakes.
Why do most investors fail to compound effectively?
Most investors fail to compound properly because they lack a structured investment system. They often:
• react emotionally to markets
• drift into concentration risk
• track performance inconsistently
• change strategy frequently
• fail to manage allocation properly
Long-term compounding usually comes from consistency and discipline rather than constant stock picking.
The assessment frequently reveals that the issue is not stock selection. It is usually process quality, measurement discipline or behavioural decision-making.
What is allocation drift?
Allocation drift happens when portfolio weightings gradually change over time because some investments outperform others. For example, a stock that began as 5% of a portfolio may quietly grow to 20% after a strong run.
Without regular portfolio reviews, allocation drift can significantly increase risk exposure without the investor fully realising it.
Why does ETF overlap matter?
ETF overlap occurs when multiple ETFs or funds own many of the same underlying companies. Investors often believe they are diversified because they hold several funds, when in reality they may still be heavily concentrated in the same sectors or stocks underneath the surface.
This hidden concentration risk is one of the most common portfolio blind spots.
Should CAGR be tracked at portfolio level?
Yes. Portfolio-level CAGR is one of the best ways to measure long-term investment performance because it annualises returns into a consistent yearly growth figure.
This allows investors to:
• compare performance over time
• benchmark against targets
• evaluate portfolio efficiency
• separate real compounding from temporary performance spikes
Tracking only individual stock returns often gives an incomplete picture.
What causes concentration risk?
Concentration risk usually develops gradually through:
• strong-performing holdings becoming oversized
• repeated contributions into the same themes
• ETF overlap
• sector overexposure
• lack of allocation discipline
Many investors become concentrated accidentally rather than intentionally.
What is a structured investment system?
A structured investment system is a repeatable framework used to manage:
• portfolio allocation
• performance measurement
• CAGR tracking
• contributions
• benchmarking
• portfolio reviews
• risk management
The goal is to make investment decisions systematically rather than emotionally.
How often should a portfolio be reviewed?
Most long-term investors should review their portfolio monthly or quarterly.
The objective is not constant activity, but maintaining awareness of:
• concentration risk
• benchmark performance
• portfolio structure
Frequent emotional changes usually damage long-term compounding.
Why do portfolios drift over time?
Portfolios drift because investments rarely grow at the same rate. Over time, stronger-performing holdings naturally become larger percentages of the portfolio.
Without rebalancing or contribution management, portfolios gradually move away from their intended structure and risk profile.
What is benchmark-relative performance?
Benchmark-relative performance compares your portfolio returns against a relevant index or benchmark after adjusting for risk and contributions.
This helps investors understand whether:
• returns are simply market-driven
• concentration risk is inflating results
• the strategy is compounding efficiently over time
Explore The Full Framework
The Investor Progression Model White Paper |
This article forms part of the Investor Progression Model — a framework for identifying how investors progress from reactive decision-making to structured long-term compounding. Inside the white paper: ✓ The four investor types ✓ The progression pathway ✓ The five dimensions of investor maturity ✓ How Structured Compounders build repeatable systems ✓ The research behind the Investor Assessment |
⬇ READ THE WHITE PAPER ⬇ |


Comments