10.3 – ETF Overlap Checker: Why Conservative Compounders Often Own the Same Portfolio Twice
Updated: 7 days ago
Most investors think diversification is obvious.
They assume that owning:
multiple ETFs
multiple funds
automatically creates a diversified portfolio.
In reality, many portfolios contain significant overlap. The same companies appear repeatedly across different ETFs. The same sectors dominate multiple funds.
The same market themes quietly become concentrated.
This is one of the biggest differences between a Conservative Compounder and a Structured Compounder.
The Conservative Compounder believes diversification exists.
The Structured Compounder verifies it.

Who This Guide Is For
This guide is for investors who:
own multiple ETFs
invest through ISAs or pensions
want genuine diversification
want to reduce hidden concentration risk
want to understand what type of investor they are becoming
want to build a more structured investment process
Most importantly:
This guide is for investors who want to progress from Conservative Compounder to Structured Compounder.
What You'll Learn | |
ETF overlap | Understand hidden duplication |
False diversification | Identify common investor mistakes |
Conservative vs Structured Compounder | Understand the difference |
Hidden concentration risk | Learn where risk hides |
Real investor examples | See overlap uncovered in practice |
Portfolio reviews | Learn what to monitor |
Long-term compounding | Improve sustainability |
Contents
Why ETF Overlap Matters
The 4 Types of Investor
Quick ETF Overlap Audit
The Conservative Compounder Trap
What ETF Overlap Actually Means
Why Diversification Can Be Misleading
Real Investor Mini Case Study
The Real Issue
What Changed
Conservative Compounder vs Structured Compounder
Why Structured Investors Improve Over Time
Who This Is For
Who This Is Not For
Hidden Portfolio Blind Spots
FAQ
Related Guides
Many investors believe they are diversified because they own:
a global ETF
an S&P 500 ETF
a technology ETF
a dividend ETF
The problem is that many of these funds own exactly the same underlying companies.
For example:
Microsoft
Apple
Nvidia
Amazon
Alphabet
can appear repeatedly across multiple ETFs. On the surface the portfolio appears diversified. Underneath it may be highly concentrated.
The result is a portfolio that looks safer than it actually is.
The 4 Types of Investor
Most investors eventually fall into one of four categories. The goal is not simply achieving acceptable returns.
The goal is becoming a Structured Compounder.

For this article the most important comparison is:
Conservative Compounder
vs
Structured Compounder
The Conservative Compounder already has:
discipline
consistency
structure
However they often assume diversification rather than measuring it. The Structured Compounder measures everything.
Quick ETF Overlap Audit
Answer these questions honestly.
✓ Do you own more than three ETFs?
✓ Have you checked the top ten holdings of each ETF?
✓ Could Microsoft appear in multiple funds?
✓ Could Apple appear in multiple funds?
✓ Have you measured sector overlap?
✓ Have you measured geographic overlap?
✓ Do you know your true exposure to technology?
✓ Do you know your true exposure to North America?
✓ Have you reviewed overlap during the last year?
✓ Do you know your actual diversification level?
If several answers concern you, overlap may already exist. Most investors discover overlap much later than they should.
Free portfolio health check • manually reviewed • delivered within 24 hours
The Conservative Compounder Trap
Conservative Compounders often do many things correctly. They:
avoid speculation
diversify across funds
review portfolios regularly
focus on long-term investing
Yet many still encounter a hidden problem. They assume:
“If I own more ETFs, I must be more diversified.”
Unfortunately, this is often untrue. Adding additional ETFs can sometimes increase overlap rather than reduce it. A portfolio containing six ETFs may actually be less diversified than a portfolio containing three.
The issue is not how many funds you own.
The issue is what those funds actually own.

Take the free 2-minute Investor Assessment
What ETF Overlap Actually Means
ETF overlap occurs when the same underlying holdings appear repeatedly across multiple funds.
Examples include:
Microsoft appearing in four ETFs
Apple appearing in three ETFs
Nvidia appearing across technology and global funds
identical sector exposure across several ETFs
multiple funds tracking highly correlated indexes
The result is hidden concentration.
The portfolio appears broader than it actually is.
Why Diversification Can Be Misleading
Many investors equate diversification with quantity.
More holdings.
More funds.
More accounts.
More ETFs.
However genuine diversification is about exposure. A portfolio can contain:
ten ETFs
hundreds of holdings
multiple brokers
while remaining heavily concentrated around:
US mega-cap technology
North American equities
growth investing
a handful of market drivers
Diversification by number is not diversification by risk.
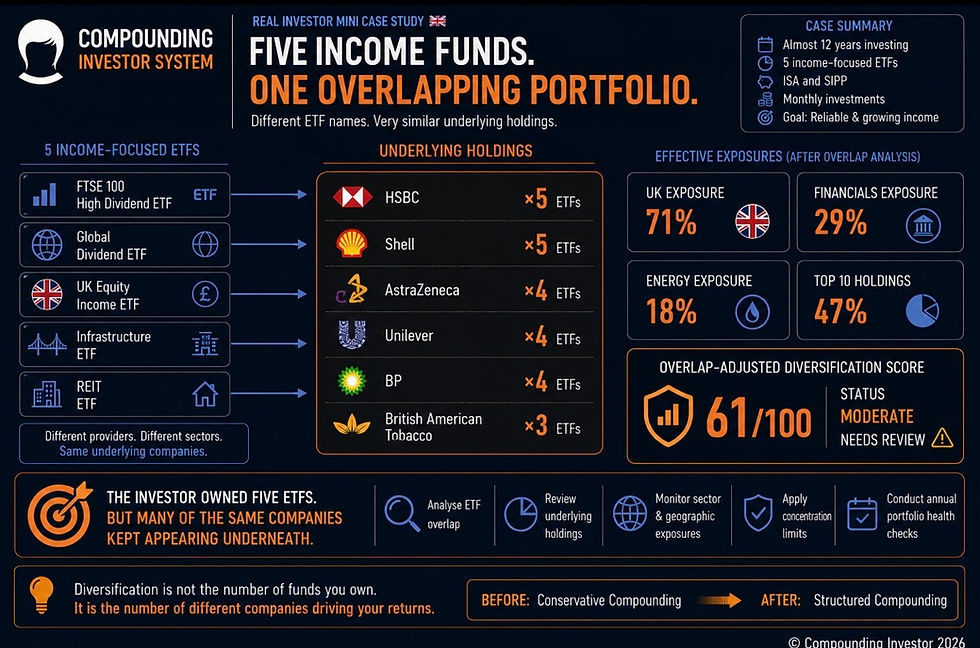
Real Investor Mini Case Study (UK 🇬🇧): The Income Portfolio That Wasn’t Diversified
A UK income driven investor had spent almost twelve years building what they believed was a well-diversified income portfolio. The objective was simple:
Generate a reliable and growing dividend income.
The portfolio contained:
a FTSE 100 High Dividend ETF
a UK Equity Income ETF
an Infrastructure ETF
a REIT ETF
an ISA and a SIPP (pension tax wrappers)
regular monthly investments
The investor deliberately avoided technology funds. Instead, they focused on income-producing investments from different fund providers.
On the surface, the portfolio appeared diversified.
Five ETFs.
Multiple sectors.
Two investment accounts.
Different investment managers.
A structured ETF overlap review revealed something very different.
What The Analysis Revealed
Although the portfolio contained five separate income-focused ETFs, many of the largest underlying holdings appeared repeatedly.
Company | Number of ETFs |
HSBC | 5 |
Shell | 5 |
AstraZeneca | 4 |
Unilever | 4 |
BP | 4 |
British American Tobacco | 3 |
After consolidating the underlying holdings, the portfolio’s effective exposures were estimated at:
UK exposure: 71%
Financials exposure: 29%
Energy exposure: 18%
Top 10 holdings exposure: 47%
The investor believed they owned:
Five different income strategies.
In reality they owned:
multiple versions of the same UK dividend portfolio.
Different ETF names. Very similar underlying holdings.
The Real Issue
The issue was not: ETF selection
The issue was not: dividend investing
The issue was not: portfolio performance
The issue was: hidden overlap.
Diversification had been judged by the number of funds. Not by the companies those funds actually owned. The investor had reduced manager risk.
They had not reduced portfolio risk.
What Changed
The investor introduced:
ETF overlap analysis
underlying holdings reviews
sector exposure monitoring
geographic diversification targets
annual portfolio health checks
The portfolio shifted from:
Conservative Compounding
towards:
Structured Compounding.
The investor continued investing for income. But diversification became intentional rather than assumed.

Free portfolio health check • manually reviewed • delivered within 24 hours
Conservative Compounder vs Structured Compounder
Conservative Compounder | Structured Compounder |
Owns multiple ETFs | Measures ETF overlap |
Assumes diversification | Verifies diversification |
Reviews holdings | Reviews exposure |
Diversified by appearance | Diversified by design |
Moderate CAGR | Sustainable high CAGR |
Structured process | Optimised process |
This is often the final transition before becoming a true Structured Compounder.
Why Structured Investors Improve Over Time
Structured Compounders understand that every new investment changes portfolio structure. They therefore monitor:
overlap
concentration
diversification quality
rather than simply counting positions.
They do not assume diversification. They measure it.
Over time this creates:
better visibility
better risk control
better decision-making
stronger compounding
The goal is not owning more investments. The goal is building a better system.
Not Sure Where You Stand: Take the Investor Assessment
Discover whether you’re a:
Reactive Investor
Lucky Investor
Conservative Compounder
Structured Compounder
Takes Less Than 2-Minutes
Who This Is For
This guide is for:
ETF investors
index investors
ISA investors
pension investors
long-term investors
Conservative Compounders
investors seeking better diversification
investors wanting clearer portfolio visibility
Who This Is NOT For
This guide is not designed for:
short-term traders
momentum investors
speculative investors
investors focused only on price movements
investors unwilling to review portfolio structure
investors uninterested in diversification analysis
FAQ
What is ETF overlap?
ETF overlap occurs when multiple ETFs own many of the same underlying companies. This creates hidden concentration risk.
Is ETF overlap always bad?
No. The problem is not overlap itself.
The problem is failing to understand how much overlap exists and how it affects portfolio risk.
How many ETFs should I own?
There is no perfect number. The focus should be on diversification quality rather than fund quantity.
Why do Conservative Compounders miss overlap?
Because the portfolio appears diversified on the surface. Without analysing underlying holdings, overlap often remains invisible.
Can ETF overlap affect performance?
Yes. Overlap can increase concentration risk and cause portfolio performance to become heavily dependent on a small number of companies or market themes.
How do Structured Compounders think differently?
They measure:
overlap
concentration
allocation
risk
rather than relying on assumptions.
Explore The Full Framework
The Investor Progression Model White Paper |
This article forms part of the Investor Progression Model — a framework for identifying how investors progress from reactive decision-making to structured long-term compounding. Inside the white paper: ✓ The four investor types ✓ The progression pathway ✓ The five dimensions of investor maturity ✓ How Structured Compounders build repeatable systems ✓ The research behind the Investor Assessment |
⬇ READ THE WHITE PAPER ⬇ |
Related Articles
Continue Your Portfolio Review
Discover the hidden weaknesses most investors never identify.
Learn how hidden risks develop and why they often remain invisible during strong market periods.
Understand allocation drift and hidden concentration risk.
Separate skill from luck and measure performance correctly.
Track allocations, sector exposure and portfolio structure systematically.
Learn the principles used by Structured Compounders to create repeatable long-term results.
Final Thought
The Conservative Compounder has already developed discipline. The Structured Compounder adds visibility.
Owning more ETFs does not automatically create diversification. Understanding what those ETFs actually own does.
That is the difference between appearing diversified and being diversified.
And it is often the final step between being a Conservative Compounder and becoming a Structured Compounder.


Comments