10.5 – Why Your Returns Feel Wrong
Updated: 7 days ago
Most investors know whether their portfolio went up. Far fewer know whether it performed well. Those sound like the same thing.
They are not.
A portfolio can rise significantly while quietly underperforming.
A portfolio can feel disappointing while actually performing extremely well.
A portfolio can appear healthy while hidden weaknesses slowly reduce long-term compounding.
This is one of the biggest differences between a Conservative Compounder and a Structured Compounder.
The Conservative Compounder tracks outcomes.
The Structured Compounder measures causes.

Who This Guide Is For
This guide is for investors who:
feel disappointed despite positive returns
feel successful but have never benchmarked performance
track portfolio value but not portfolio quality
want stronger long-term compounding
want greater portfolio visibility
want to understand what type of investor they are becoming
want a more structured investment process
Most importantly:
This guide is for investors who want to progress from Conservative Compounder to Structured Compounder.
What You'll Learn | |
Performance illusions | Understand why returns can feel misleading |
Benchmarking | Learn what good performance actually means |
Portfolio blind spots | Identify hidden weaknesses |
Investor psychology | Understand common perception errors |
Dashboard analysis | Learn what Structured Compounders measure |
Real investor example | See performance illusions uncovered |
Long-term compounding | Improve decision quality |
Contents
Why Returns Often Feel Wrong
The 4 Types of Investor
Quick Performance Audit
The Conservative Compounder Trap
The Missing Dashboard
Real Investor Mini Case Study
What The Analysis Revealed
The Real Issue
What Changed
What Would Your Dashboard Reveal?
Conservative Compounder vs Structured Compounder
Hidden Portfolio Blind Spots
FAQ
Related Guides
Why Returns Often Feel Wrong
Imagine two investors.
Investor A achieves:
11% CAGR
Investor B achieves:
9% CAGR
Most people would assume Investor A performed better.
Now imagine:
Investor A’s benchmark returned 13%.
Investor B’s benchmark returned 7%.
Suddenly the story changes.
Investor A underperformed.
Investor B outperformed.
Neither investor knew. Because neither measured performance properly.
Many investors focus on what their portfolio did.
Structured Compounders focus on whether it did what it should have done.
Five Reasons Your Returns Feel Wrong
Inflation distortion
Benchmark mismatch
Dividend exclusion
Recency bias
Concentration effects
The 4 Types of Investor

The goal is not simply achieving acceptable returns. The goal is becoming a Structured Compounder.
For this article the most important comparison is:
Conservative Compounder
vs
Structured Compounder
The Conservative Compounder already has:
discipline
patience
consistency
However they often evaluate performance emotionally rather than systematically. The Structured Compounder measures everything.
Quick Performance Audit
Answer these questions honestly.
✓ Do you know your portfolio CAGR?
✓ Do you benchmark performance?
✓ Do you know whether you outperformed your benchmark?
✓ Do you know your largest holding?
✓ Do you know your technology allocation?
✓ Do you know your diversification score?
✓ Do you know your portfolio health score?
✓ Have you measured ETF overlap?
✓ Could you explain exactly why your portfolio performed as it did last year?
✓ Do you know what type of investor you are?
If several questions were difficult to answer, you may already have a visibility problem. The strongest investors don’t just track returns.
They understand:
why returns occurred
where risk is hiding
whether performance is genuine
how close they are to becoming a Structured Compounder
The free 2-minute Investor Assessment was designed to measure exactly that.
It identifies:
✓ Your Investor Type
✓ Your Investor Score
✓ Your biggest compounding weakness
✓ Your next progression step
✓ Your initial dashboard
Free 2-minute assessment • manually reviewed • delivered within 24 hours
The Conservative Compounder Trap
Most Conservative Compounders are already doing many things correctly. They:
invest consistently
avoid speculation
think long term
build sensible portfolios
review investments regularly
Yet many still feel uncertain about performance. They assume:
“My portfolio went up, therefore it must be performing well.”
Unfortunately that is not always true.
Markets rise.
Strong sectors rise.
Entire indexes rise.
Returns alone do not tell the whole story. The issue is not whether your portfolio increased.
The issue is whether it increased for the right reasons.

The Missing Dashboard
Most investors monitor a single number:
Portfolio Value
Structured Compounders monitor an entire system.

After completing the Investor Assessment, investors unlock their first dashboard. Most investors expect the assessment to tell them what type of investor they are.
What surprises them is everything else it reveals.
The dashboard measures:
Behaviour Score
Process Discipline
Many investors discover that their biggest weakness is not stock selection.
It is their investment process.
The assessment reveals what most investors never measure.
Take the free 2-minute Investor Assessment
Real Investor Mini Case Study (Ireland 🇮🇪): Why The Returns Never Felt Good
Note: Original portfolio values were denominated in euro. Figures below have been converted into US dollars for consistency with this guide.
A long-term focused Irish investor had been investing consistently for more than twelve years. They considered themselves:
disciplined
patient
a successful investor
The portfolio contained:
monthly contributions
global equity ETFs
a growing pension portfolio
regular annual investments from work bonuses
Every year the portfolio reached a new all-time high. The account value kept increasing. Yet the investor always felt disappointed.
Despite twelve years of investing, it never felt as though the portfolio was compounding as expected.
What The Analysis Revealed
A structured portfolio review uncovered something the investor had never measured. The review identified:
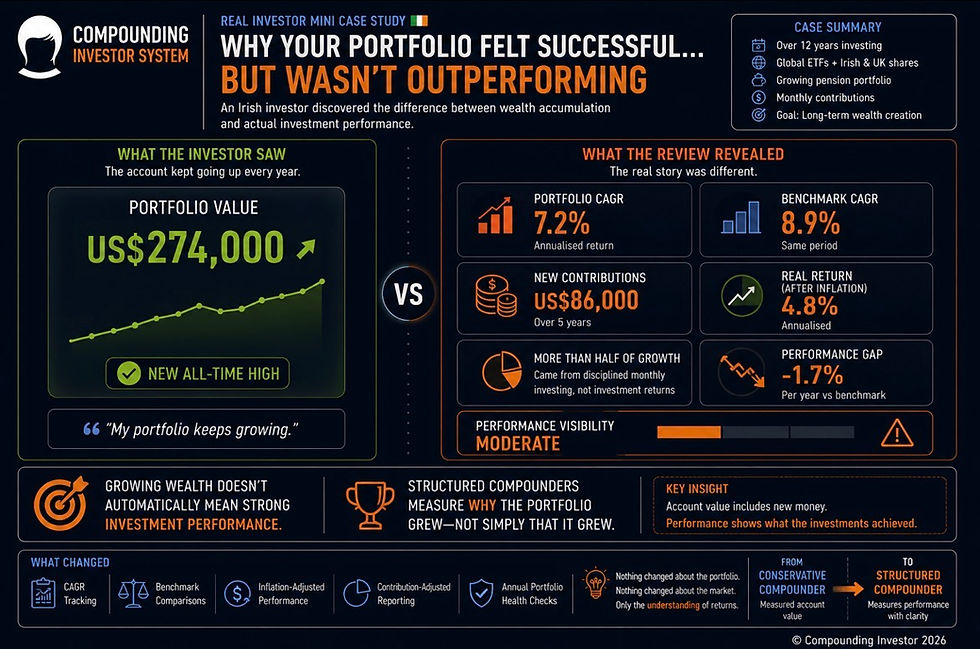
Portfolio value had increased from approximately US$145,000 to US$274,000 over five years.
During the same period the investor had contributed approximately US$86,000 of new capital.
The portfolio CAGR was 7.2%, not the 11–12% the investor believed.
After allowing for inflation, the real annual return was estimated at approximately 4.8%.
The chosen benchmark delivered 8.9% CAGR over the same period.
More than half of the portfolio’s growth came from disciplined monthly investing rather than investment performance.
The portfolio was growing. But the investor had confused wealth accumulation with investment performance.
Every monthly contribution made the account balance larger.
That made the portfolio feel more successful than it actually was.
The Real Issue
The issue was not: investing discipline
The issue was not: contribution consistency
The issue was not: portfolio quality
The issue was: measurement.
The investor measured account value.
They never separated the effect of new money from the return generated by the investments themselves.
Without that distinction, every year felt successful…and yet somehow disappointing.
What Changed
The investor introduced:
benchmark comparisons
contribution-adjusted reporting
dashboard monitoring
Nothing changed about the portfolio.
Nothing changed about the market.
The only thing that changed was the investor’s understanding of what the returns were actually saying.
For the first time, they could separate money invested from wealth created—the point at which a Conservative Compounder begins to think like a Structured Compounder.
What Type Of Investor Are You?
Most investors fall into one of four categories:
Conservative Compounder
Structured Compounder
Most have no idea which one they are.
The assessment takes less than two minutes.
Your results include:
✓ Investor Type
✓ Investor Score
✓ Progression Guidance
✓ Partial Investor Dashboard
Free assessment • manually reviewed • delivered within 24 hours
What Would Your Dashboard Reveal?
The investor in this example believed:
✓ Portfolio performing well
✓ Diversified
✓ Strong long-term results
The dashboard ACTUALLY revealed:
Most investors are surprised by what their assessment uncovers. Because the assessment doesn’t simply tell you what type of investor you are. It begins revealing why your portfolio behaves the way it does.
Free assessment • manually reviewed • delivered within 24 hours

Conservative Compounder vs Structured Compounder
Conservative Compounder | Structured Compounder |
Tracks portfolio value | Tracks portfolio health |
Focuses on returns | Focuses on causes |
Reviews holdings | |
Sees outcomes | Understands drivers |
Assumes performance | Measures performance |
Understanding your portfolio health is often the final transition before becoming a true Structured Compounder.
Hidden Portfolio Blind Spots
Returns that feel wrong are rarely the only issue. Many portfolios also contain:
hidden geographic concentration
performance illusions
Most portfolios contain at least two or three of these weaknesses. Most investors never discover them.
Structured Compounders do.
Discover What Is Really Limiting Your Compounding
Most investors try to improve their portfolio before understanding the real problem. Structured Compounders do the opposite.
They measure first.
The Investor Assessment reveals:
where you currently sit on the Investor Progression Model
how your investment process compares with other investors
the biggest factor limiting your compounding
your next progression step
Your dashboard is then generated automatically. Some sections are immediately visible. Others remain locked until portfolio analysis is completed.
This is intentional.
The strongest investors measure before they optimise.
Step 1: Investor Assessment
Receive:
Investor Type
Investor Score
Progression Stage
Partial Dashboard
Step 2: Portfolio Intelligence Report
Unlock:
Step 3: Build Your Structured Compounder System
Turn insights into a repeatable process.
Step 4: Continue Improving
Track progress towards Structured Compounder status and maintain this status on an ongoing basis.
Takes Less Than 2-Minutes
Who This Is For
This guide is for:
ETF investors
index investors
ISA investors
pension investors
long-term investors
Conservative Compounders
investors seeking better diversification
investors wanting clearer portfolio visibility
Who This Is NOT For
This guide is not designed for:
short-term traders
momentum investors
speculative investors
investors focused only on price movements
investors unwilling to review portfolio structure
investors uninterested in diversification analysis
FAQ
Why do my returns feel disappointing even when my portfolio rises?
Because absolute returns and relative performance are different. A portfolio can rise while still underperforming its benchmark.
Why do Structured Compounders measure more than returns?
Because returns are an outcome. Understanding allocation, concentration, benchmarking and diversification helps explain why returns occurred.
Can a portfolio perform well but still have hidden weaknesses?
Yes. Many portfolios contain concentration risk, ETF overlap, allocation drift and benchmark mismatch despite producing acceptable returns.
What does the Investor Assessment measure?
The assessment measures investor behaviour, process maturity, benchmarking discipline and overall progression towards Structured Compounder status.
What happens after the assessment?
You receive your Investor Type, Investor Score and a personalised dashboard showing where you currently sit on the Investor Progression Model.
Explore The Full Framework
The Investor Progression Model White Paper |
This article forms part of the Investor Progression Model — a framework for identifying how investors progress from reactive decision-making to structured long-term compounding. Inside the white paper: ✓ The four investor types ✓ The progression pathway ✓ The five dimensions of investor maturity ✓ How Structured Compounders build repeatable systems ✓ The research behind the Investor Assessment |
⬇ READ THE WHITE PAPER ⬇ |
Related Articles
Continue Your Portfolio Review
Discover the hidden weaknesses most investors never identify.
Learn how hidden risks develop and why they often remain invisible during strong market periods.
Understand allocation drift and hidden concentration risk.
Discover how to measure if your portfolio has hidden overlap risks.
Assess your own portfolio to see if there are blind spots you haven't noticed.
Separate skill from luck and measure performance correctly.
Learn the principles used by Structured Compounders to create repeatable long-term results.
Final Thought
The Conservative Compounder measures results. The Structured Compounder measures the system producing those results.
When returns feel wrong, the problem is often not performance.
The problem is visibility.
Because the strongest investors do not simply know what happened.
They know why it happened.
And that journey starts by understanding what type of investor they really are.


Comments