3.9 – Portfolio Risk Allocation: Where Is Your Investment Risk Really Coming From?
Updated: 7 days ago
Your Portfolio Weight and Your Portfolio Risk Are Not the Same Thing
Most investors understand portfolio allocation in terms of money. They can see:
how much is invested in equities
how much is invested in bonds
the percentage held in each stock
their largest sectors
how much is held in cash
That information matters. But it can create an important illusion. Imagine an investor has a $1,000,000 portfolio containing:
60% Equities30% Bonds10% Cash
On the surface, the portfolio appears reasonably balanced.
Only 60% of the capital is invested in equities.
A substantial 40% sits elsewhere.
But those percentages tell us where the money is allocated. They don’t necessarily tell us:
Where is the portfolio’s risk actually coming from?
If equities fluctuate substantially more than bonds and cash, they can have a much greater influence over portfolio gains, losses and drawdowns than their 60% capital allocation suggests.
The same issue can exist inside the equity allocation. Suppose the investor owns:
a US equity ETF
several individual technology stocks
a growth ETF
a European equity fund
At holding level, the portfolio contains several different investments. At risk level, some of those investments may depend on many of the same things.
The global ETF may already contain substantial US exposure.
The growth ETF may contain several of the same technology companies held directly.
The individual stocks may belong to sectors already heavily represented elsewhere.
And when markets become stressed, investments that normally appear different can sometimes move in the same direction. The portfolio therefore needs to be understood through two different lenses:
Where Is My Capital Allocated?
and:
What Actually Drives My Portfolio Risk?
Those aren’t necessarily the same thing. Consider two investments that each represent 10% of a portfolio.
Investment A is relatively stable.
Investment B experiences much larger price movements and deeper drawdowns.
Both have: Portfolio Weight: 10%
But they don’t necessarily have the same influence over portfolio risk. This creates an important distinction:
Portfolio Weight ≠ Portfolio Risk Contribution
That doesn’t mean investors need complicated institutional risk models. For most long-term investors, the practical objective is simpler. You want to understand:
which investments could have the greatest effect on portfolio losses
whether several holdings depend on similar underlying exposures
whether one asset class dominates portfolio outcomes
whether sector or geographic concentration is increasing risk
whether ETF overlap is reinforcing risks already present elsewhere
what could happen if several important exposures decline together
This takes portfolio analysis beyond simply asking:
“How much money do I have invested here?”
towards:
“How much does my portfolio depend on what happens here?”
That distinction also separates portfolio risk allocation from individual position sizing. Position sizing asks:
“How much influence should I allow one investment to have?”
Portfolio risk allocation asks:
“Where does the risk across the whole portfolio actually come from?”
The objective isn’t to distribute risk equally across every investment. Nor is it to eliminate anything that contributes substantial risk. A long-term equity investor may deliberately accept that equities will drive much of the portfolio’s volatility and long-term return.
The important thing is understanding that relationship.
In this guide, we’ll examine how portfolio risk allocation works, why portfolio weight can give an incomplete picture of risk, how concentration and correlation interact, how ETFs can hide shared exposures and how Structured Compounders move from simply allocating capital towards understanding what actually drives portfolio outcomes.

Who This Guide Is For
This guide is designed for long-term investors who already understand the basic structure of their portfolio but want to understand the risk underneath that structure.
It will be particularly valuable if you:
own several stocks, ETFs or funds
have deliberately diversified across different investments
want to understand whether your portfolio is as diversified as it appears
own investments with very different risk characteristics
have significant equity exposure alongside bonds or cash
want to understand how correlation can concentrate portfolio risk
hold several investments exposed to similar companies, sectors or economies
are approaching retirement or becoming more focused on portfolio downside
want to move beyond portfolio percentages towards a more structured understanding of risk
are progressing towards becoming a Structured Compounder
As investors progress through the Investor Progression Model, the question changes. An early-stage investor may ask:
“What investments do I own?”
A developing investor asks:
“How is my money allocated?”
A Structured Compounder increasingly asks:
“What actually determines what happens to my portfolio?”
That is the progression this guide explores.
What You'll Learn | |
Capital Allocation vs Risk Allocation | Why the percentage of money invested in something doesn’t necessarily represent its influence over portfolio risk. |
Where Portfolio Risk Comes From | How holdings, asset classes, sectors, geographies and shared exposures combine to influence portfolio outcomes. |
Concentration and Correlation | Why apparently different investments can depend on similar risks and behave similarly when markets become stressed. |
How to Stress-Test Portfolio Risk | Practical ways to examine what could happen when several important exposures decline together. |
How ETFs Affect Portfolio Risk | Why multiple diversified funds can still leave a portfolio dependent on overlapping companies, sectors and markets. |
The Investor Progression Model | How investors progress from allocating capital towards understanding and deliberately managing portfolio-level risk. |
Contents
What Is Portfolio Risk Allocation?
Capital Allocation vs Risk Allocation
Where Does Portfolio Risk Actually Come From?
Why Equal Portfolio Weights Don’t Mean Equal Risk
Concentration, Correlation and Portfolio Risk
How ETFs Can Hide Shared Portfolio Risks
Asset, Sector and Geographic Risk Concentration
How to Stress-Test Your Portfolio
How Portfolio Risk Changes Over Time
The Investor Progression Model: From Allocating Capital to Understanding Risk
When Higher Risk Concentration May Be Deliberate
Common Portfolio Risk Allocation Mistakes
Real Investor Case Study — Bellagio, Italy 🇮🇹
What the Review Revealed
The Real Issue
What Changed
Before vs After Portfolio Risk Review
Quick Portfolio Risk Audit
Who This Guide Is For
Who This Guide Is Not For
FAQ
Explore The Full Framework
Related Articles
Final Thought
What Is Portfolio Risk Allocation?
Portfolio risk allocation is the process of understanding which parts of your portfolio have the greatest influence over its overall risk.
Traditional portfolio allocation measures where your money is invested. For example:
Equities: 60% Bonds: 30% Cash: 10%
Portfolio risk allocation asks a different question:
How much does each part of the portfolio contribute to the risk of the whole?
Those two pictures can be very different.
If equities experience much larger price movements than bonds or cash, the 60% equity allocation may account for substantially more than 60% of the portfolio’s volatility and potential drawdown.
The same principle applies to individual holdings.
Two investments can each represent 5% of the portfolio while having very different potential effects on portfolio outcomes. Portfolio risk allocation therefore looks beyond:
How Much Capital Is Invested?
towards:
How Much Portfolio Risk Is Being Created?
For a long-term investor, this doesn’t require calculating every possible statistical measure of risk. A practical review can consider:
volatility
potential drawdown
asset-class exposure
correlation between investments
how different holdings might behave during the same market event
The objective is not to remove risk. Risk is an unavoidable part of investing. The objective is to understand where that risk is concentrated and whether you deliberately want it there.

Capital Allocation vs Risk Allocation
Risk allocation tells you how strongly those different investments can influence portfolio outcomes. Consider a $1,000,000 portfolio:
Asset | Capital Allocation |
Equities | 60% |
Bonds | 30% |
Cash | 10% |
Looking only at capital, equities represent a little over half the portfolio. But imagine equities are considerably more volatile than the bonds, while cash contributes almost no market volatility.
The portfolio’s risk may therefore be much more concentrated in equities than the capital percentages suggest. This creates the central distinction:
Capital Allocation ≠ Risk Allocation
Neither measure replaces the other.
They answer different questions.
Capital allocation asks: “Where is my money invested?”
Risk allocation asks: “What is most capable of changing my portfolio outcome?”
This distinction becomes particularly important when investors describe a portfolio as diversified because capital has been distributed across many holdings. A portfolio can be diversified by number of investments while remaining concentrated by source of risk.
Structured portfolio analysis therefore considers both.
Because knowing where your money sits is only part of understanding the portfolio.
You also need to understand what that money ultimately depends on.
Where Does Portfolio Risk Actually Come From?
Portfolio risk rarely comes from one place. It develops through several layers of exposure interacting with each other.
Individual Holdings
The larger the position, the more a company-specific event can affect the overall portfolio.
Asset Classes
Equities, bonds, cash and other assets behave differently.
A portfolio containing 70% equities may naturally derive much of its short-term volatility and drawdown risk from that equity allocation.
Sectors
Several holdings can depend on the same part of the economy.
An investor might own ten different companies while still having substantial exposure to technology, financials or energy.
Geographies
Companies and funds can also depend disproportionately on particular countries or regions. A portfolio that appears globally diversified may still be strongly influenced by one major market.
Underlying ETF Exposure
ETFs add another layer. Different funds can own many of the same companies, sectors and countries. The investor sees several ETF positions. The underlying portfolio may contain repeated exposure to the same sources of risk.
Correlation
Finally, risk depends on how investments behave together. Two investments might appear completely different when examined individually. But if they tend to rise and fall together, combining them may provide less diversification than expected.
This is why portfolio risk needs to be analysed at portfolio level. The important question isn’t simply:
“What risks does each investment contain?”
It is:
“Which risks appear repeatedly across the investments I collectively own?”
Why Equal Portfolio Weights Don’t Mean Equal Risk
Imagine a portfolio contains two investments:
Investment A: 10%
Investment B: 10%
From a capital-allocation perspective, they are identical. Each controls one-tenth of the portfolio.
But suppose Investment A is a relatively stable investment while Investment B regularly experiences much larger price movements.
If both fall during difficult markets, Investment B may have considerably greater influence over the portfolio’s losses.
The same principle applies across an entire portfolio.
Suppose an investor owns ten stocks at 5% each. The positions are equally weighted. But that doesn’t mean they contribute equally to portfolio risk. One company may have:
highly variable earnings
substantial debt
cyclical revenues
greater share-price volatility
while another may have much more stable characteristics.
Equal capital weights therefore create equal capital exposure, not equal risk. This is particularly important when investors use equal weighting as a diversification rule.
Equal weighting can prevent one investment from receiving an enormous initial allocation. But it cannot guarantee that each holding contributes the same amount of risk. A more useful question is:
“If this investment experiences a severe adverse outcome, how much could it affect the portfolio?”
Position size provides part of the answer.
The characteristics of the investment provide another.
And its relationship with everything else you own completes the picture.
Concentration, Correlation and Portfolio Risk
Concentration is often understood as owning too much of one investment. That is one form of concentration. But portfolio risk can also become concentrated when investors own different investments that respond to the same underlying forces.
Imagine a portfolio contains:
a large technology company
a technology-sector ETF
a growth ETF
a global equity ETF
another individual semiconductor stock
These are five separate holdings. But they may share substantial exposure to:
large technology companies
growth stocks
semiconductor demand
interest-rate expectations
US equity markets
It may be much less diversified by risk.
This is where correlation becomes important.
Correlation describes the extent to which investments tend to move together. If two holdings regularly respond similarly to the same market conditions, combining them may provide less diversification than combining investments whose returns behave differently.
The problem can become particularly visible during market stress. Investments that appeared reasonably independent during normal conditions can sometimes decline together when investors react to the same economic shock. This creates a useful distinction:
Holding Concentration → Too Much Capital in One Investment
Risk Concentration → Too Much Portfolio Dependence on the Same Outcome
A Structured Compounder considers both.
Because owning 20 investments is not necessarily diversified if many of those investments ultimately depend on the same things going right.
How ETFs Can Hide Shared Portfolio Risks
ETFs can provide excellent diversification. But they can also make portfolio risk harder to see. Imagine an investor owns:
Global Equity ETF: 40%
US Equity ETF: 20%
Technology ETF: 10%
Individual Stocks: 20%
Bonds: 10%
At holding level, the portfolio appears spread across several investments. But look underneath the ETF wrappers.
The global ETF already contains major US companies.
The US ETF contains many of those companies again.
The technology ETF may concentrate heavily in some of the same businesses.
And the individual-stock allocation may include those companies directly.
The investor doesn’t necessarily have four independent sources of equity exposure. They may have four different routes to some of the same underlying risks. This can create hidden concentration across:
Companies → Sectors → Countries → Investment Styles
The issue isn’t that any of the ETFs is poorly diversified individually. Each fund might perform exactly the role it was designed to perform. The problem emerges when the funds are combined.
Portfolio risk therefore needs to be analysed across the underlying holdings, not simply across the names of the funds. Instead of asking:
“How many ETFs do I own?”
ask:
“What risks do these ETFs collectively expose me to?”
That shift from fund-level diversification to portfolio-level exposure can reveal concentrations that aren’t obvious from the holdings list alone.
Asset, Sector and Geographic Risk Concentration
Portfolio risk can become concentrated simultaneously across several dimensions.
Suppose an investor has: 70% Equities
Within those equities: 35% Technology
And within that technology allocation: A substantial concentration in US companies
Those aren’t three completely separate observations. They may describe layers of the same underlying portfolio risk. If US technology stocks experience a major downturn, the portfolio could be affected through:
its high equity allocation
individual technology stocks
This is why risk shouldn’t always be added together mechanically.
The same underlying exposure can appear in several portfolio classifications. Instead, the investor needs to understand how those layers connect. A useful review moves through:
Asset Class → Sector → Geography → Holdings → Underlying Exposure
For example, you might discover that:
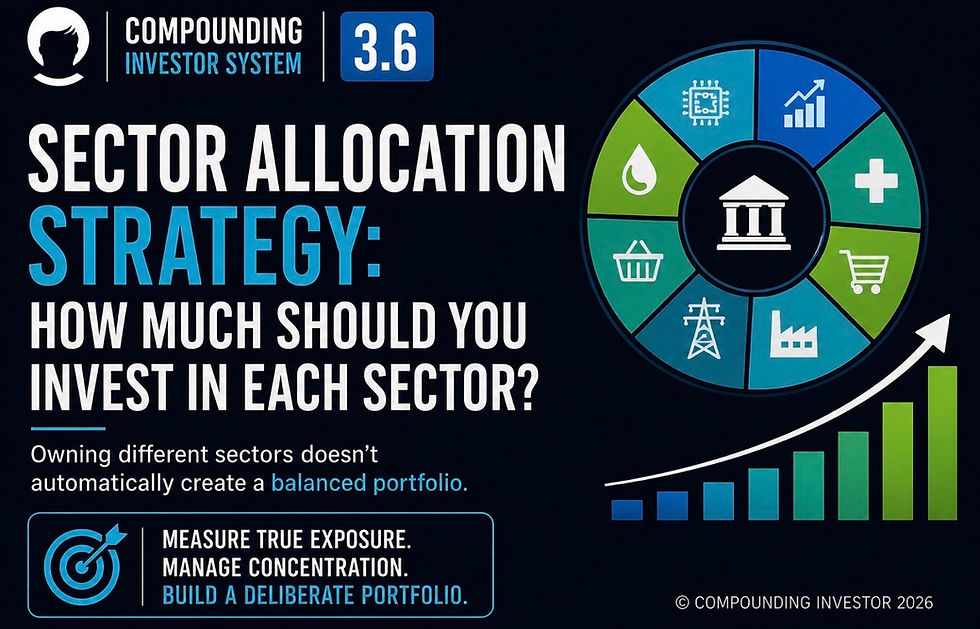
Asset Allocation - shows substantial equity exposure.
Sector Allocation - shows a large technology weighting.
Geographic Allocation - shows significant US exposure.
ETF Analysis - shows that several funds repeatedly own the same large US technology companies.
Each layer adds information. Together, they explain what the portfolio is actually depending on. This doesn’t automatically mean the portfolio needs to change.
An investor may deliberately want substantial exposure to equities, the United States or a particular sector. The purpose of portfolio risk allocation isn’t to make every dimension perfectly balanced. It is to distinguish:
Risk You Deliberately Chose
from:
That is where portfolio allocation starts becoming portfolio risk management.
How to Stress-Test Your Portfolio
Portfolio allocation tells you what your portfolio looks like today. A stress test asks a different question:
This is particularly useful for understanding risk concentration. Suppose a $1,000,000 portfolio contains:
Global Equity ETF: 40%
US Equity ETF: 20%
Individual Stocks: 15%
Bonds: 20%
Cash: 5%
The holdings appear reasonably diversified. But analysis reveals substantial overlap between the global ETF, US ETF and individual stocks. A simple stress test might ask:
What happens if US equities fall 30%?
Then:
What happens if technology stocks fall 40% at the same time?
Then:
Which of my individual holdings and ETFs would be affected by both?
The objective isn’t to predict that these events will occur. It is to understand the portfolio consequences if they did. You can stress-test several types of risk:
a major equity-market decline
a severe fall in your largest stock
a sector-specific downturn
weakness in your largest geographic exposure
several correlated holdings falling together
an adverse currency movement
simultaneous weakness across overlapping ETF exposures
For individual positions, a simple calculation can be useful:
Portfolio Impact = Position Weight × Assumed Investment Decline
If a stock represents 10% of the portfolio and falls 50%:
10% × 50% = 5% portfolio impact
But portfolio-level stress testing goes further. If the same economic event could simultaneously affect several holdings, you need to consider their combined influence. The most useful question becomes:
“What could hurt several important parts of my portfolio at the same time?”
That is where hidden risk concentration often becomes visible.
How Portfolio Risk Changes Over Time
Portfolio risk isn’t static. Even if you never deliberately change your investment strategy, the amount and location of risk within the portfolio can change.
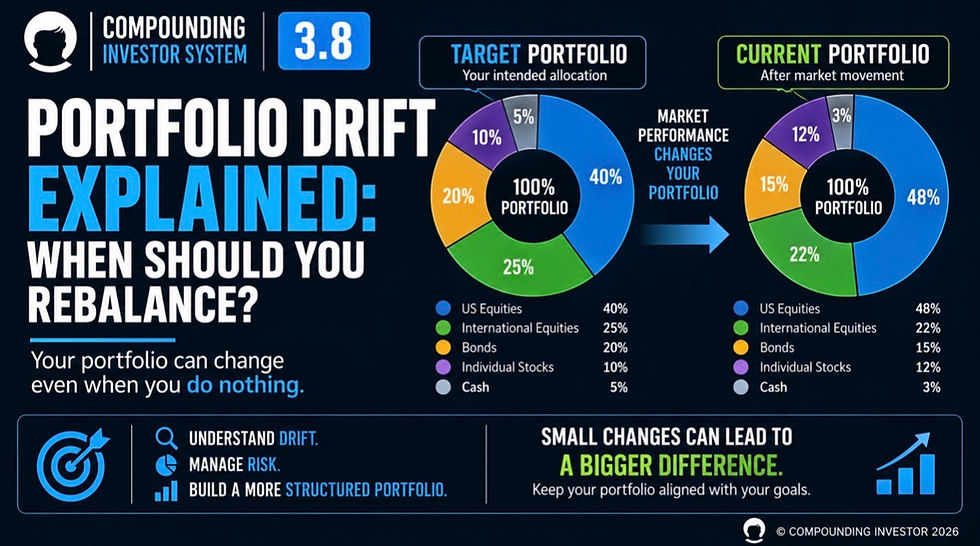
One reason is portfolio drift.
If equities outperform bonds for several years, they may become a larger percentage of the portfolio.
If one sector substantially outperforms others, sector concentration can increase.
But risk can also change without the headline portfolio weights moving very much.
An ETF can become increasingly concentrated in a small number of large companies.
Two holdings that previously provided different exposures can become more closely connected.
A company can take on more debt or become more cyclical.
The economic environment can change the way different assets behave together.
This means investors need to consider two forms of change:
How portfolio weights have changed.
and:
Risk Drift
How the underlying sources and concentration of portfolio risk have changed. The two can occur together. But they don’t have to. A portfolio could remain:
60% Equities / 30% Bonds / 10% Cash
for years while the composition and concentration of the equity risk changes considerably underneath those headline percentages. This is why a structured portfolio review shouldn’t simply ask:
“Are my allocations still close to target?”
It should also ask:
“Do those allocations still represent the risks I think they do?”
The Investor Progression Model: From Allocating Capital to Understanding Risk
The Investor Progression Model helps explain how portfolio thinking develops. An early-stage investor often focuses on investments:
“Which stocks and ETFs should I own?”
The next stage begins thinking about allocation:
“How much should I invest in each?”
A more structured investor starts looking underneath those percentages:
“What exposures have I actually created?”
The Structured Compounder goes further:
“Where does my portfolio risk come from, and is that where I deliberately want it to be?”
The progression becomes:
Choose Investments → Allocate Capital → Measure Exposure → Understand Risk → Control Portfolio Influence
This represents an important shift.
Instead of treating diversification as a count of holdings, the investor starts considering how those holdings interact.
Instead of assuming a 5% position creates 5% of portfolio risk, they consider the characteristics of the investment.
Instead of assuming several ETFs represent several independent sources of diversification, they examine what those ETFs collectively own.
And instead of simply asking:
“Is my portfolio diversified?”
they ask:
“What would have to go wrong for several parts of my portfolio to struggle at the same time?”
That is a much more useful way to think about portfolio-level risk. Because structured investing isn’t simply about spreading capital. It is about understanding what your portfolio ultimately depends on.

When Higher Risk Concentration May Be Deliberate
Risk concentration isn’t automatically a portfolio mistake. Sometimes it is the intended consequence of an investor’s strategy.
A long-term investor with a high equity allocation may deliberately accept that equities will dominate short-term portfolio volatility.
An investor with strong conviction in a particular company may deliberately allow it to become a larger position.
Another investor may intentionally overweight a particular sector or country.
The important distinction is between:
Deliberate Risk Concentration
and:
Unrecognised Risk Concentration
Deliberate concentration means the investor understands:
where the concentration exists
why it exists
what could cause it to perform poorly
how much damage an adverse outcome could create
how it interacts with the rest of the portfolio
whether they remain comfortable accepting that risk
Unrecognised concentration is different.
The investor may believe they are diversified because they own many investments, without recognising that several depend on the same companies, sectors, geographies or market conditions.
There is therefore no requirement for every portfolio to distribute risk equally. That could conflict with the investor’s objectives entirely. The more useful principle is:
If you deliberately choose it, understand its consequences and remain comfortable with the potential downside, concentration may form part of a coherent investment strategy.
If you only discover it after something goes wrong, the portfolio wasn’t being managed with the same degree of control.
Common Portfolio Risk Allocation Mistakes
Portfolio risk allocation becomes most useful when it reveals what ordinary portfolio percentages cannot. Common mistakes include:
assuming capital allocation and risk allocation are the same thing
treating equal-sized positions as equally risky
measuring diversification by the number of holdings
focusing on individual investments without considering how they interact
ignoring correlation between major positions
assuming different ETFs automatically provide different risks
overlooking repeated company exposure across ETFs and direct holdings
reviewing asset allocation while ignoring sector and geographic concentration
looking at each type of concentration independently when several represent the same underlying exposure
focusing on volatility without considering potential drawdown
failing to stress-test several correlated exposures simultaneously
assuming portfolio risk remains unchanged because target allocations haven’t changed
treating all concentration as undesirable
allowing deliberate concentration to become larger without periodic review
Perhaps the most important mistake is asking only:
“How much have I invested in each part of my portfolio?”
That question is necessary. But it isn’t sufficient. A more complete review asks:
Where is my capital allocated?
Which investments create the greatest potential portfolio impact?
Which holdings share the same underlying exposures?
What could cause several of them to decline together?
Where is risk concentrated across assets, sectors and geographies?
Is that concentration deliberate?
Would I still choose to accept it today?
The objective isn’t to engineer a portfolio in which nothing can fall. Such a portfolio doesn’t exist. It is to make the relationship between:
Capital → Exposure → Risk → Portfolio Impact
visible enough that the risks you take are understood rather than accidental.
Discover What Your Portfolio Risk Reveals About You
Owning investments across multiple assets, sectors and geographies doesn’t automatically mean your portfolio risk is well diversified.
The important question is whether each investment and exposure has the level of influence over portfolio risk you actually intend.
The Free Investor Assessment helps identify:
portfolio-risk and concentration blind spots
whether overlapping holdings and ETFs are creating unintended risk exposure
whether your portfolio risk is more concentrated than your capital allocation suggests
your current Investor Progression Model stage
practical next steps towards becoming a Structured Compounder
Because successful portfolio risk allocation isn’t about spreading money evenly across as many investments as possible.
It’s about understanding where your portfolio risk actually comes from and how much influence you want each source of risk to have.
Only takes 2-minutes • manually reviewed • delivered within 24 hours
The Retired Investor Whose “Defensive” Holdings Shared the Same Risk
This long-term investor was a 68-year-old retired architect living in Bellagio on Lake Como. His $1.15 million portfolio had been deliberately made more conservative after retirement.
Over several years, he had reduced individual stocks and added investments he considered defensive:
a European dividend ETF
an infrastructure fund
a utilities ETF
investment-grade bonds
cash
No individual position was particularly large.
Equities had also been reduced substantially from their pre-retirement level.
Looking at the allocation spreadsheet, the Investor believed he had achieved exactly what he wanted:
less dependence on growth stocks and more defensive diversification.
But the portfolio review revealed something the allocation percentages didn’t show. Several of the investments Lorenzo had added for different reasons were vulnerable to the same underlying event.

What The Review Revealed
The Investor had mentally classified his investments according to their labels:
Dividend
Infrastructure
Utilities
Bonds
They appeared to represent different sources of risk. But when the portfolio was stress-tested against a sharp rise in interest rates, those distinctions became less reassuring.
His bonds could fall as yields increased.
Higher-yielding dividend shares could become less attractive relative to bonds.
Utilities and infrastructure businesses could be sensitive to financing costs because of their capital requirements and debt.
Even some of the supposedly defensive equity holdings appeared repeatedly across his dividend and infrastructure funds.
The investments weren’t identical. Nor would they necessarily move by the same amount. But the Investor had unknowingly constructed several different positions that could all be adversely affected by the same underlying economic change.
His capital allocation looked diversified.
His risk allocation was less diversified than he thought.
The Real Issue
The problem wasn’t that the Investor owned bonds, dividend stocks, utilities or infrastructure. Each could have a legitimate role within the portfolio. The problem was the logic he had used when combining them:
Different Investment Labels = Different Portfolio Risks
That assumption wasn’t reliable. The Investor had diversified across products without fully examining the economic forces those products depended upon.
This became particularly important because he was retired.
His objective wasn’t to eliminate volatility, but he wanted different parts of the portfolio to provide genuinely different sources of risk and return.
Instead, he had unintentionally built a portfolio where several supposedly defensive components could become vulnerable simultaneously. The review therefore changed the question from:
“How much do I have in each investment?”
to:
“What could cause several of these investments to struggle at the same time?”
That exposed something his allocation percentages alone could never show. The portfolio contained more holdings than it contained genuinely independent sources of risk.
What Changed
The Investor didn’t respond by selling every interest-rate-sensitive investment. Nor did he attempt to create a portfolio where every holding behaved differently under every possible scenario.
Instead, he introduced a simple shared-risk review. Alongside his normal allocation analysis, he began asking:
What Is the Position? → What Drives It? → What Else Depends on the Same Driver? → What Happens If That Driver Moves Against Me?
His portfolio was then stress-tested across several broad scenarios rather than examining investments individually. That allowed the Investor to see where apparently different holdings might respond to the same event.
Some exposures were retained because their concentration was understood and acceptable. Others were gradually adjusted as the portfolio was rebalanced.
Most importantly, the Investor stopped treating the name attached to an investment as evidence that it provided a different source of diversification.
His retirement portfolio still contained equities, bonds and defensive investments. But he now understood the difference between:
Owning Different Investments
and:
Depending on Different Risks
For this Investor, that was the real portfolio-risk allocation breakthrough.
Diversification wasn’t about how many boxes his investments occupied. It was about how many different things had to go wrong before the portfolio suffered materially.
Before vs After Portfolio Risk Review
A portfolio risk review changes the focus from where capital is invested to understanding what actually has the greatest influence over portfolio outcomes.
Basic Portfolio Risk View | Structured Portfolio Risk View |
Measures portfolio percentages | Considers both capital allocation and risk allocation |
Treats similar-sized positions similarly | Recognises that equal weights can create different levels of risk |
Counts holdings as evidence of diversification | Examines whether holdings depend on genuinely different risks |
Reviews investments individually | Considers how investments can behave together |
Treats different ETFs as separate exposures | Looks beneath ETFs for overlapping risks |
Monitors asset allocation | Also reviews sector, geographic and underlying exposure |
Focuses primarily on volatility | Considers potential portfolio impact and drawdown |
Assumes diversification remains relatively stable | Recognises that portfolio risk can change over time |
Avoids concentration | Distinguishes deliberate from unintended concentration |
Asks: “Where is my money invested?” | Asks: “What does my portfolio actually depend on?” |
The objective isn’t to distribute risk equally.
It is to ensure that the risks capable of materially affecting your portfolio are visible, understood and deliberately accepted.
Quick Portfolio Risk Audit
Ask yourself:
✓ Do I understand the difference between capital allocation and risk allocation?
✓ Do I know which investments could have the greatest impact on my portfolio during a significant decline?
✓ Do I understand which holdings depend on similar underlying economic forces?
✓ Have I looked beneath my ETFs for repeated company, sector and geographic exposure?
✓ Could several apparently different investments struggle during the same market event?
✓ Do I understand where my largest sector and geographic risks sit?
✓ Have I stress-tested my largest or most correlated exposures?
✓ Do I consider how portfolio risk changes as investments grow and allocations drift?
✓ Is any significant risk concentration deliberate?
✓ Would I still choose to accept those concentrations today?
If several answers are “No”, your portfolio may be more diversified by investment name than it is by underlying risk.
Who This Guide Is For
This guide is designed for investors who want to move beyond measuring where their capital is allocated towards understanding where their portfolio risk actually comes from. It will be particularly valuable if you:
own multiple stocks, ETFs or funds
already track asset allocation
believe your portfolio is diversified but want to test that assumption
own several investments with overlapping exposures
want to understand how correlation affects diversification
have significant sector or geographic concentrations
want to stress-test the portfolio rather than analyse holdings independently
are approaching retirement and becoming more focused on downside risk
want to distinguish deliberate risk-taking from accidental concentration
are progressing towards becoming a Structured Compounder
The objective isn’t to construct a portfolio without risk.
It is to understand which risks you are taking, how they interact and how much influence they have over the portfolio.
Who This Guide Is NOT For
This guide is unlikely to be useful if you:
want predictions about the next market downturn
are looking for investments guaranteed to reduce risk
want to eliminate portfolio volatility
expect every investment to contribute exactly the same amount of risk
want a single risk score to replace portfolio judgement
assume owning more investments automatically creates better diversification
want complex institutional risk modelling rather than a practical long-term investment framework
It is also not an argument that concentrated risk is automatically undesirable.
An investor may deliberately accept substantial equity, sector, geographic or individual-investment risk.
The important distinction is whether that concentration is understood and intentional rather than hidden inside the portfolio.
Discover What Your Portfolio Risk Reveals About You
Most investors already know how their capital is allocated. They can see:
Individual holdings
Portfolio percentages
Asset allocation
Sector and geographic exposure
Their largest positions
Yet many still cannot answer some of the most important questions about their overall investment process.
Where does most of my portfolio risk actually come from?
Are different investments exposing me to the same underlying risks?
Is my portfolio more concentrated by risk than its capital allocation suggests?
What stage of the Investor Progression Model am I currently at?
What should I change to become a more structured long-term investor?
Your portfolio may already appear well diversified across multiple investments. But spreading capital across different holdings isn’t the same as understanding what your portfolio ultimately depends on.
The Free Investor Assessment helps identify:
hidden weaknesses in your portfolio risk structure
your current Investor Progression Model stage
concentration, correlation and underlying exposure blind spots
opportunities to build a more structured investment system
practical next steps towards becoming a Structured Compounder
Because the best investors don’t simply understand where their money is invested.
They understand where their portfolio risk comes from and which exposures have the greatest influence over their outcomes.
And once those risks are visible, you can make far better decisions about allocation, diversification, concentration and long-term compounding.
Takes Less Than 2-Minutes
FAQ
What is portfolio risk allocation?
Portfolio risk allocation describes how the sources of risk within a portfolio are distributed. It looks beyond the percentage of capital invested in each holding to consider which investments and exposures have the greatest influence over portfolio outcomes.
Is risk allocation the same as asset allocation?
No. Asset allocation measures how capital is distributed between assets such as equities, bonds and cash. Risk allocation asks how much those different parts of the portfolio contribute to overall portfolio risk.
Can a diversified portfolio still have concentrated risk?
Yes. A portfolio can contain many investments while several depend on the same companies, sectors, countries or economic conditions. Diversification by holding count therefore doesn’t necessarily mean diversification by risk.
Do equal portfolio weights create equal risk?
Not necessarily. Two stocks representing 5% of a portfolio have the same capital allocation, but their volatility, potential drawdown and relationship with other holdings can be very different.
How does correlation affect portfolio risk?
Correlation describes how investments tend to move in relation to each other. If several important holdings respond similarly to the same conditions, their combined risk can be more concentrated than their individual portfolio weights suggest.
Can ETFs create hidden portfolio risk?
Yes. Different ETFs can contain many of the same companies, sectors and geographic exposures. Each ETF may be diversified individually while the combined portfolio contains substantial underlying overlap.
What is portfolio stress testing?
Portfolio stress testing asks what could happen to the overall portfolio under adverse scenarios. Rather than predicting the future, it examines the potential consequences if a major stock, sector, geography or group of correlated investments declines substantially.
Is volatility the same as risk?
Not necessarily. Volatility measures fluctuations in investment values, but investors may also care about drawdowns, permanent capital loss, concentration and whether several holdings could decline together. Portfolio risk analysis therefore shouldn’t rely on volatility alone.
Does portfolio risk change over time?
Yes. Portfolio drift, changing investment characteristics, ETF composition and changing relationships between holdings can all alter where risk sits within the portfolio.
Should I eliminate concentrated portfolio risk?
Not automatically. Some concentration may be deliberate and consistent with your investment strategy. The important question is whether you understand the concentration, its potential consequences and whether you remain comfortable accepting it.
Explore The Full Framework
The Investor Progression Model White Paper |
This guide forms part of the Compounding Investor Progression Model—a framework designed to help investors move from reactive decision-making towards a repeatable, structured investment process. Inside the white paper you’ll discover: ✓ The four investor types ✓ Why most investors plateau ✓ The five dimensions of investor progression ✓ How Structured Compounders build repeatable systems ✓ The research behind the Investor Assessment |
⬇ READ THE WHITE PAPER ⬇ |
Related Articles
Continue Building Your Portfolio Management System
Build the target → actual → variance framework for understanding where portfolio capital is allocated.
Understand when changes in portfolio structure become significant enough to justify intervention.
Examine how individual position size determines the influence one company can have over portfolio outcomes.
Explore why increasing the number of holdings doesn’t necessarily create proportionately greater diversification.
Identify where portfolio exposure is concentrated across different parts of the economy.
Understand how much influence different countries and regions have over the portfolio.
See how different investment returns can gradually change both portfolio structure and the risks you originally intended to take.
Look beneath ETF wrappers to identify repeated companies, sectors and geographic exposures.
Connect allocation, concentration, exposure, performance and risk within a broader structured portfolio-analysis process.
Final Thought
Most investors can answer: “Where is my money invested?”
Far fewer can answer: “Where does my portfolio risk actually come from?”
The difference matters. A portfolio can contain dozens of holdings.
It can spread capital across several asset classes.
It can own multiple ETFs, sectors and countries.
And it can still depend heavily on a relatively small number of underlying risks.
Which investments have the greatest potential portfolio impact?
Which holdings depend on the same underlying forces?
What could cause several of them to struggle simultaneously?
Has portfolio drift changed where my risk sits?
Which concentrations are deliberate?
Would I still choose those risks today?
The objective isn’t to eliminate uncertainty.
Nor is it to make every investment equally risky.
It is to make the relationship between:
Capital → Exposure → Risk → Portfolio Impact
visible enough to support deliberate decisions.
It is about understanding what you are ultimately depending on once that money is invested.

Comments